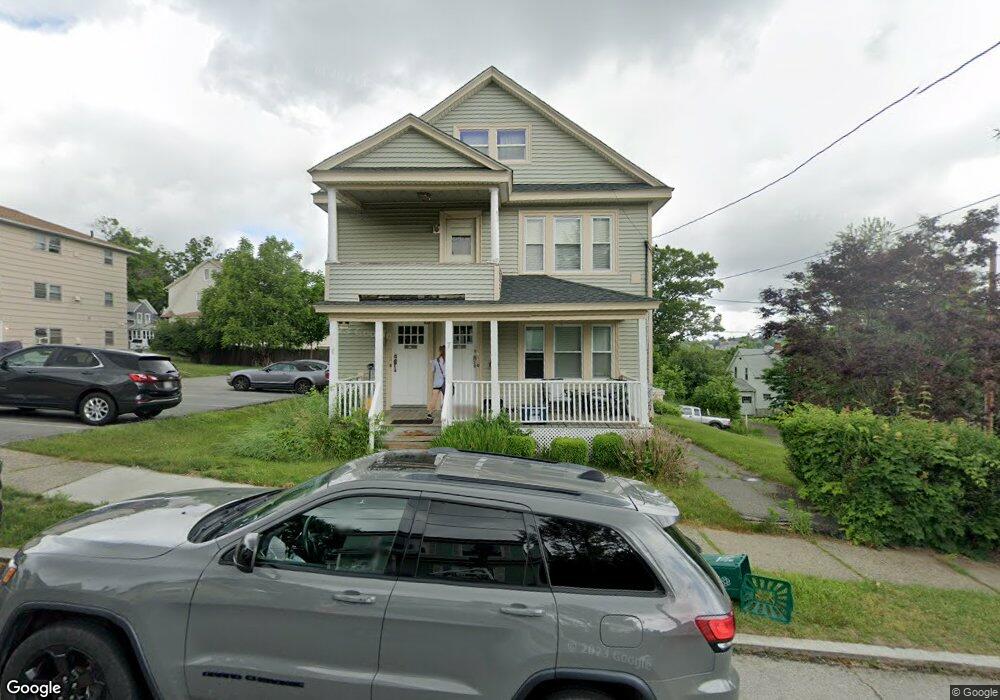
7 Merrill Rd Worcester, MA 01606
Indian Lake East NeighborhoodEstimated Value: $537,699 - $628,000
4
Beds
2
Baths
2,212
Sq Ft
$258/Sq Ft
Est. Value
About This Home
This home is located at 7 Merrill Rd, Worcester, MA 01606 and is currently estimated at $571,675, approximately $258 per square foot. 7 Merrill Rd is a home located in Worcester County with nearby schools including Francis J. McGrath Elementary School, Jacob Hiatt Magnet School, and Chandler Magnet.
Ownership History
Date
Name
Owned For
Owner Type
Purchase Details
Closed on
Nov 30, 2005
Sold by
Finnegan Karen M
Bought by
Donahue Patrick M
Current Estimated Value
Home Financials for this Owner
Home Financials are based on the most recent Mortgage that was taken out on this home.
Original Mortgage
$241,520
Interest Rate
6.14%
Mortgage Type
Purchase Money Mortgage
Purchase Details
Closed on
Apr 30, 2004
Sold by
Tivnan John M
Bought by
Finnegan Karen M
Home Financials for this Owner
Home Financials are based on the most recent Mortgage that was taken out on this home.
Original Mortgage
$270,243
Interest Rate
5.36%
Mortgage Type
Purchase Money Mortgage
Purchase Details
Closed on
Mar 7, 2000
Sold by
Callahan William
Bought by
Tivnan John M
Purchase Details
Closed on
Apr 29, 1999
Sold by
Assoc Home Equity Svc
Bought by
Callahan William
Create a Home Valuation Report for This Property
The Home Valuation Report is an in-depth analysis detailing your home's value as well as a comparison with similar homes in the area
Home Values in the Area
Average Home Value in this Area
Purchase History
| Date | Buyer | Sale Price | Title Company |
|---|---|---|---|
| Donahue Patrick M | $301,900 | -- | |
| Finnegan Karen M | $275,000 | -- | |
| Tivnan John M | $130,000 | -- | |
| Callahan William | $75,000 | -- |
Source: Public Records
Mortgage History
| Date | Status | Borrower | Loan Amount |
|---|---|---|---|
| Open | Callahan William | $228,759 | |
| Closed | Donahue Patrick M | $241,520 | |
| Previous Owner | Finnegan Karen M | $270,243 | |
| Previous Owner | Callahan William | $204,000 |
Source: Public Records
Tax History
| Year | Tax Paid | Tax Assessment Tax Assessment Total Assessment is a certain percentage of the fair market value that is determined by local assessors to be the total taxable value of land and additions on the property. | Land | Improvement |
|---|---|---|---|---|
| 2025 | $6,591 | $499,700 | $113,200 | $386,500 |
| 2024 | $6,289 | $457,400 | $113,200 | $344,200 |
| 2023 | $5,877 | $409,800 | $98,400 | $311,400 |
| 2022 | $5,407 | $355,500 | $78,700 | $276,800 |
| 2021 | $4,925 | $302,500 | $63,000 | $239,500 |
| 2020 | $4,636 | $272,700 | $63,000 | $209,700 |
| 2019 | $4,651 | $258,400 | $56,600 | $201,800 |
| 2018 | $4,561 | $241,200 | $56,600 | $184,600 |
| 2017 | $4,357 | $226,700 | $56,600 | $170,100 |
| 2016 | $4,312 | $209,200 | $41,900 | $167,300 |
| 2015 | $4,199 | $209,200 | $41,900 | $167,300 |
| 2014 | $4,088 | $209,200 | $41,900 | $167,300 |
Source: Public Records
Map
Nearby Homes
- 106 Tower St
- 5 Merrill Rd
- 8 Merrill Rd
- 35 Boardman St
- 3 Merrill Rd
- 10 Merrill Rd
- 110 Tower St
- 12 Merrill Rd
- 12 Merrill Rd Unit 2
- 34 Boardman St
- 103 Tower St Unit 5
- 4 Merrill Rd
- 31 Boardman St
- 7 W Boylston Dr
- 3 W Boylston Dr Unit GROUND
- 3 W Boylston Dr Unit 2L
- 3 W Boylston Dr Unit 1R
- 3 W Boylston Dr
- 3 W Boylston Dr Unit 2R
- 3 W Boylston Dr Unit 1
Your Personal Tour Guide
Ask me questions while you tour the home.