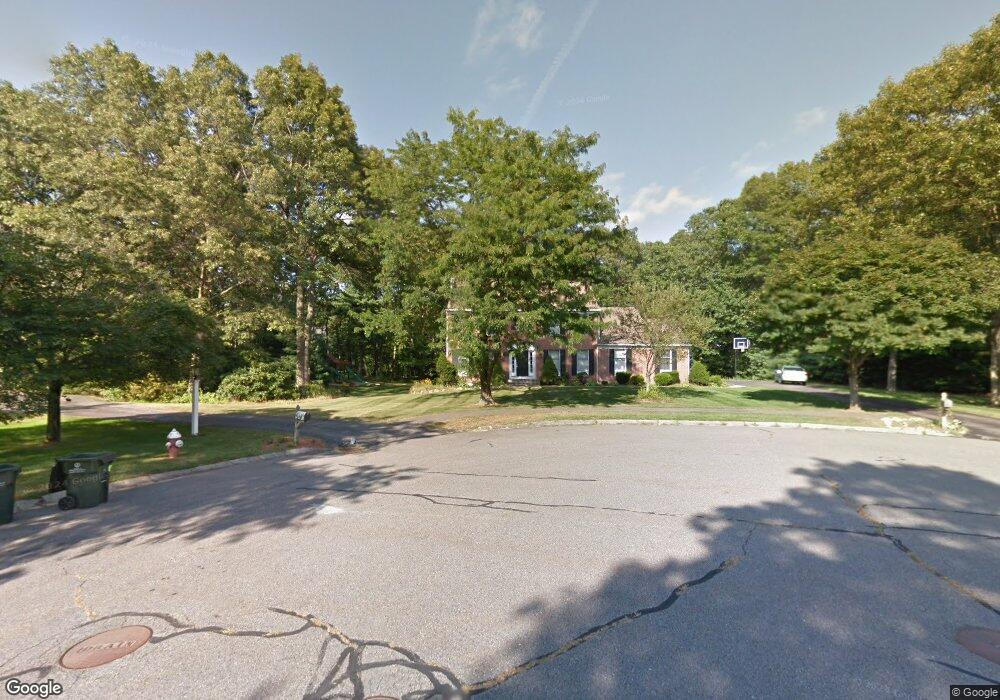
7 Mine Brook Ct Franklin, MA 02038
Estimated Value: $997,450 - $1,107,000
4
Beds
3
Baths
2,610
Sq Ft
$403/Sq Ft
Est. Value
About This Home
This home is located at 7 Mine Brook Ct, Franklin, MA 02038 and is currently estimated at $1,051,363, approximately $402 per square foot. 7 Mine Brook Ct is a home located in Norfolk County with nearby schools including Oak Street Elementary School, Horace Mann Middle School, and Franklin High School.
Ownership History
Date
Name
Owned For
Owner Type
Purchase Details
Closed on
Jul 1, 2009
Sold by
Katinas Stephan B and Katinas Dionne E
Bought by
Mcintyre David P and Mcintyre Judy D
Current Estimated Value
Home Financials for this Owner
Home Financials are based on the most recent Mortgage that was taken out on this home.
Original Mortgage
$402,400
Outstanding Balance
$256,560
Interest Rate
4.86%
Mortgage Type
Purchase Money Mortgage
Estimated Equity
$794,803
Purchase Details
Closed on
Jul 28, 1997
Sold by
Thyrum Martin O and Thyrum Marit B
Bought by
Katinas Stephen B and Katinas Dionne E
Home Financials for this Owner
Home Financials are based on the most recent Mortgage that was taken out on this home.
Original Mortgage
$188,000
Interest Rate
7.7%
Mortgage Type
Purchase Money Mortgage
Purchase Details
Closed on
Jun 30, 1995
Sold by
Paolucci Salvatore and Paolucci Maris
Bought by
Thyrum Martin O and Thyrum Marit B
Purchase Details
Closed on
Apr 23, 1990
Sold by
Franklin Farms Lp
Bought by
Paolucci Salvatore
Create a Home Valuation Report for This Property
The Home Valuation Report is an in-depth analysis detailing your home's value as well as a comparison with similar homes in the area
Home Values in the Area
Average Home Value in this Area
Purchase History
| Date | Buyer | Sale Price | Title Company |
|---|---|---|---|
| Mcintyre David P | $503,000 | -- | |
| Katinas Stephen B | $267,000 | -- | |
| Thyrum Martin O | $271,000 | -- | |
| Paolucci Salvatore | $276,728 | -- |
Source: Public Records
Mortgage History
| Date | Status | Borrower | Loan Amount |
|---|---|---|---|
| Open | Mcintyre David P | $402,400 | |
| Previous Owner | Paolucci Salvatore | $155,000 | |
| Previous Owner | Paolucci Salvatore | $190,000 | |
| Previous Owner | Paolucci Salvatore | $188,000 |
Source: Public Records
Tax History Compared to Growth
Tax History
| Year | Tax Paid | Tax Assessment Tax Assessment Total Assessment is a certain percentage of the fair market value that is determined by local assessors to be the total taxable value of land and additions on the property. | Land | Improvement |
|---|---|---|---|---|
| 2025 | $10,027 | $862,900 | $364,800 | $498,100 |
| 2024 | $10,134 | $859,500 | $364,800 | $494,700 |
| 2023 | $9,916 | $788,200 | $338,500 | $449,700 |
| 2022 | $9,657 | $687,300 | $291,800 | $395,500 |
| 2021 | $8,838 | $603,300 | $279,800 | $323,500 |
| 2020 | $8,561 | $590,000 | $282,700 | $307,300 |
| 2019 | $8,605 | $587,000 | $279,800 | $307,200 |
| 2018 | $8,081 | $551,600 | $277,000 | $274,600 |
| 2017 | $8,168 | $560,200 | $285,600 | $274,600 |
| 2016 | $7,518 | $518,500 | $247,100 | $271,400 |
| 2015 | $7,048 | $474,900 | $238,400 | $236,500 |
| 2014 | $6,578 | $455,200 | $218,700 | $236,500 |
Source: Public Records
Map
Nearby Homes
- 2 Noanet Brook Ln
- 60 Southgate Rd
- 41 Kimberlee Ave
- 208 Irondequoit Rd
- 336 Maple St
- 2 Kayla Dr
- 159 Highwood Dr
- 2211 Franklin Crossing Rd Unit 2211
- 1805 Franklin Crossing Rd
- 66 Highwood Dr
- 83 Highwood Dr Unit 83
- 605 Franklin Crossing Rd
- 31 Highwood Dr
- 214 Conlyn Ave
- 951 Pond St
- 57 Raymond St Unit 2
- 204 Lincoln St
- 17 Pine St
- 14 Hawthorne Village Unit D
- 6 Buena Vista Dr
- 12 Mill River Cir
- 5 Ashbury Dr
- 8 Mine Brook Ct
- 3 Ashbury Dr
- 6 Mine Brook Ct
- 7 Ashbury Dr
- 14 Mill River Cir
- 4 Mill River Cir
- 1 Mill River Cir
- 1 Ashbury Dr
- 3 Mill River Cir
- 4 Ashbury Dr
- 9 Ashbury Dr
- 2 Ashbury Dr
- 16 Mill River Cir
- 6 Ashbury Dr
- 2 Mill River Cir
- 413 Brenda Ln
- 397 Brenda Ln
- 5 Mill River Cir