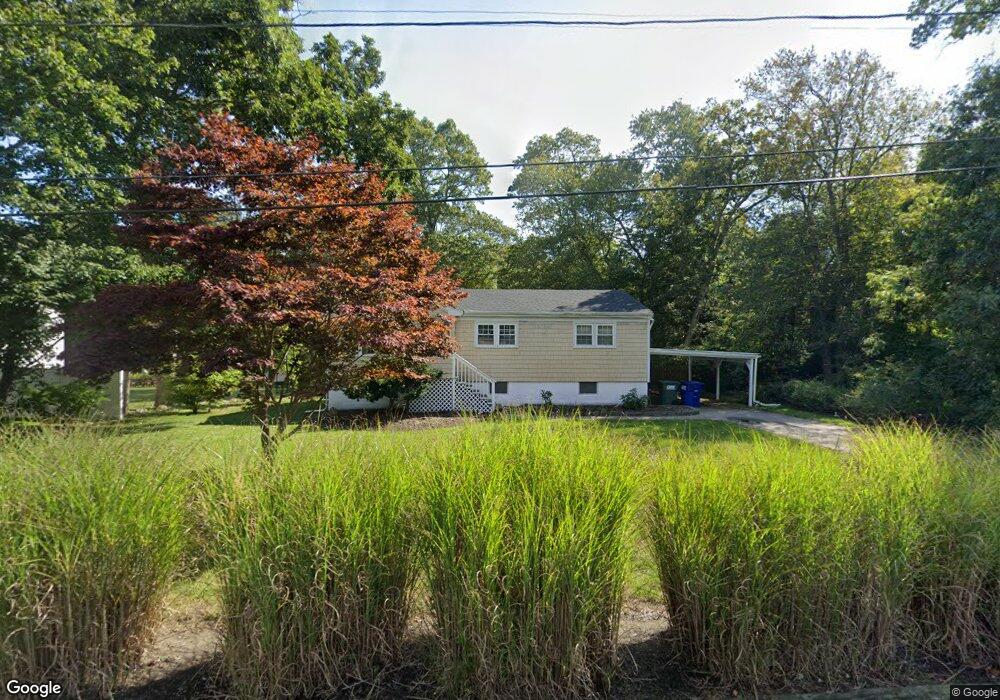
7 Mockingbird Ln Westerly, RI 02891
Estimated Value: $449,680 - $533,000
3
Beds
1
Bath
1,112
Sq Ft
$435/Sq Ft
Est. Value
About This Home
This home is located at 7 Mockingbird Ln, Westerly, RI 02891 and is currently estimated at $483,670, approximately $434 per square foot. 7 Mockingbird Ln is a home located in Washington County with nearby schools including Westerly High School and St. Michael School.
Ownership History
Date
Name
Owned For
Owner Type
Purchase Details
Closed on
Sep 1, 2005
Sold by
Oliveira Nelson
Bought by
Maher Donna and Maher Gregory
Current Estimated Value
Home Financials for this Owner
Home Financials are based on the most recent Mortgage that was taken out on this home.
Original Mortgage
$212,000
Outstanding Balance
$109,614
Interest Rate
5.81%
Mortgage Type
Purchase Money Mortgage
Estimated Equity
$374,056
Purchase Details
Closed on
Feb 27, 2003
Sold by
Ballato Charles J
Bought by
Oliveira Nelson D
Home Financials for this Owner
Home Financials are based on the most recent Mortgage that was taken out on this home.
Original Mortgage
$140,000
Interest Rate
5.98%
Purchase Details
Closed on
Dec 12, 1995
Sold by
Coyle Sarah F Est
Bought by
Ballato Charles J
Home Financials for this Owner
Home Financials are based on the most recent Mortgage that was taken out on this home.
Original Mortgage
$77,000
Interest Rate
7.44%
Create a Home Valuation Report for This Property
The Home Valuation Report is an in-depth analysis detailing your home's value as well as a comparison with similar homes in the area
Home Values in the Area
Average Home Value in this Area
Purchase History
| Date | Buyer | Sale Price | Title Company |
|---|---|---|---|
| Maher Donna | $265,000 | -- | |
| Oliveira Nelson D | $175,000 | -- | |
| Ballato Charles J | $88,000 | -- |
Source: Public Records
Mortgage History
| Date | Status | Borrower | Loan Amount |
|---|---|---|---|
| Open | Ballato Charles J | $212,000 | |
| Previous Owner | Ballato Charles J | $140,000 | |
| Previous Owner | Ballato Charles J | $26,250 | |
| Previous Owner | Ballato Charles J | $77,000 |
Source: Public Records
Tax History
| Year | Tax Paid | Tax Assessment Tax Assessment Total Assessment is a certain percentage of the fair market value that is determined by local assessors to be the total taxable value of land and additions on the property. | Land | Improvement |
|---|---|---|---|---|
| 2025 | $2,862 | $367,900 | $167,200 | $200,700 |
| 2024 | $2,895 | $277,000 | $119,400 | $157,600 |
| 2023 | $2,814 | $277,000 | $119,400 | $157,600 |
| 2022 | $2,798 | $277,000 | $119,400 | $157,600 |
| 2021 | $2,715 | $225,100 | $103,900 | $121,200 |
| 2020 | $2,667 | $225,100 | $103,900 | $121,200 |
| 2019 | $2,643 | $225,100 | $103,900 | $121,200 |
| 2018 | $2,528 | $204,700 | $103,900 | $100,800 |
| 2017 | $2,424 | $202,000 | $103,900 | $98,100 |
| 2016 | $2,424 | $202,000 | $103,900 | $98,100 |
| 2015 | $2,556 | $227,600 | $111,100 | $116,500 |
| 2014 | $2,515 | $227,600 | $111,100 | $116,500 |
Source: Public Records
Map
Nearby Homes
- 33 Whipple Ave
- 21 North Dr
- 19 Crestview Dr Unit C
- 23 Abbey Ln Unit 12
- 24 Abbey Ln Unit 13
- 6 Wilder Ave
- 18 Timothy Dr
- 16 Spring St
- 25 School St Unit 2
- 12 Apache Dr Unit A
- 22 Colonial Dr
- 17 Apache Dr Unit G
- 19 Apache Dr Unit F
- 19 Apache Dr Unit 19C
- 22 Summertime Cir
- 23 Summertime Cir
- 39 Summertime Cir
- 38 Summertime Cir
- 25 Summertime Cir
- 45 Summertime Cir
Your Personal Tour Guide
Ask me questions while you tour the home.