
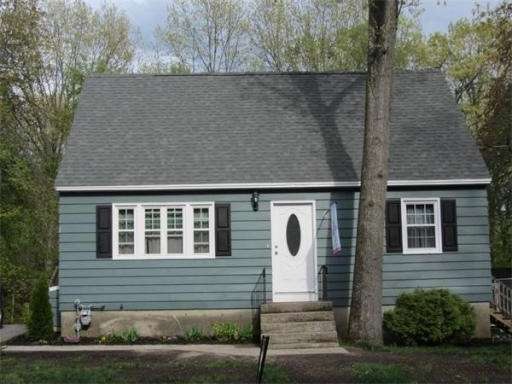
7 Peach Dr Nashua, NH 03060
Southeast Nashua Neighborhood
3
Beds
2
Baths
1,724
Sq Ft
7,405
Sq Ft Lot
About This Home
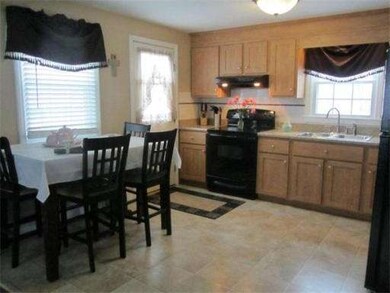
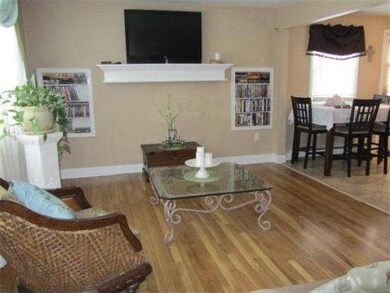
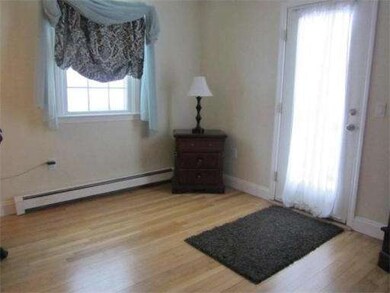
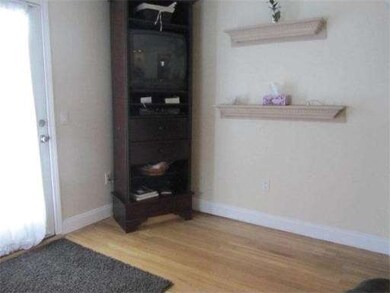
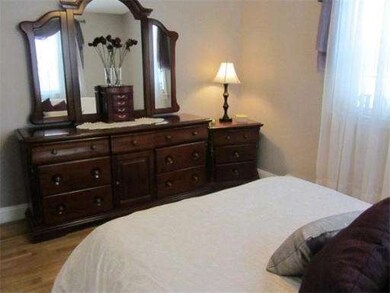
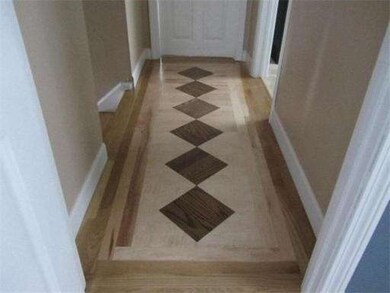
As of April 2017NOTHING to do but move in and ENJOY!!! Remodeled kitchen & 2 full baths. All hardwood has been professionally refinished throughout first level. Custom hardwood inlay in upper hall. New carpets 2nd floor bedrooms. All new interior paint throughout; very tastefully done. Replacement windows. Newly finished lower level with daylight windows and a hidden moveable wall to facilitate moving furniture ina nd out. Great neighborhood on dead end street yet easily accessible to DW highway. Don't wait!!
Last Agent to Sell the Property
Better Homes and Gardens Real Estate - The Masiello Group Listed on: 03/08/2013
Last Buyer's Agent
Better Homes and Gardens Real Estate - The Masiello Group Listed on: 03/08/2013
Home Details
Home Type
Single Family
Est. Annual Taxes
$6,326
Year Built
1960
Lot Details
0
Listing Details
- Lot Description: Level
- Special Features: None
- Property Sub Type: Detached
- Year Built: 1960
Interior Features
- Has Basement: Yes
- Number of Rooms: 7
- Electric: Circuit Breakers
- Flooring: Vinyl, Wall to Wall Carpet, Hardwood
- Interior Amenities: Cable Available
- Basement: Full, Finished, Interior Access, Bulkhead
- Bedroom 2: First Floor, 10X9
- Bedroom 3: Second Floor, 19X2
- Kitchen: First Floor, 12X11
- Living Room: First Floor, 15X12
- Master Bedroom: Second Floor, 19X10
- Family Room: Basement, 10X17
Exterior Features
- Construction: Frame
- Exterior: Clapboard, Wood
- Exterior Features: Deck, Storage Shed
- Foundation: Poured Concrete
Garage/Parking
- Parking Spaces: 2
Utilities
- Hot Water: Natural Gas
- Utility Connections: for Electric Range
Ownership History
Date
Name
Owned For
Owner Type
Purchase Details
Closed on
Apr 27, 2022
Sold by
Collins Trevor J
Bought by
Collins Trevor J and Collins Heather M
Current Estimated Value
Home Financials for this Owner
Home Financials are based on the most recent Mortgage that was taken out on this home.
Original Mortgage
$190,000
Outstanding Balance
$179,517
Interest Rate
4.16%
Mortgage Type
New Conventional
Estimated Equity
$326,493
Purchase Details
Listed on
Mar 2, 2017
Closed on
Apr 28, 2017
Sold by
Boyce Shannen H
Bought by
Collins Trevor J
Seller's Agent
Susan Monette
Compass
Buyer's Agent
Kathy Cronin
Gibson Sotheby's International Realty
List Price
$250,000
Sold Price
$270,000
Premium/Discount to List
$20,000
8%
Home Financials for this Owner
Home Financials are based on the most recent Mortgage that was taken out on this home.
Avg. Annual Appreciation
7.91%
Original Mortgage
$170,000
Interest Rate
4.3%
Mortgage Type
Unknown
Purchase Details
Closed on
Feb 16, 2017
Sold by
Casey Sean F
Bought by
Boyce Shannen H
Purchase Details
Listed on
Mar 8, 2013
Closed on
Jul 29, 2013
Sold by
Sharpton David C and Sharpton Jacqueline R
Bought by
Casey Sean F and Boyce Shannen H
Seller's Agent
Arlene Hajjar
Better Homes and Gardens Real Estate - The Masiello Group
Buyer's Agent
Arlene Hajjar
Better Homes and Gardens Real Estate - The Masiello Group
List Price
$244,900
Sold Price
$220,000
Premium/Discount to List
-$24,900
-10.17%
Home Financials for this Owner
Home Financials are based on the most recent Mortgage that was taken out on this home.
Avg. Annual Appreciation
7.18%
Purchase Details
Closed on
Jan 22, 2009
Sold by
Bank Of America Na Tr
Bought by
Sharpton David C and Denney Jacqueline R
Purchase Details
Closed on
Oct 22, 2008
Sold by
Coulombe Joseph
Bought by
Lasalle Bank Na
Purchase Details
Closed on
May 19, 2006
Sold by
Bressler 3Rd Walter R
Bought by
Coloumbe Joseph
Purchase Details
Closed on
May 10, 2006
Sold by
Wilmot John James and Wilmot Darlene Marie
Bought by
Bressler 3Rd Walter R
Purchase Details
Closed on
Jan 14, 2000
Sold by
Shappy Julie A and Shappy Lee A
Bought by
Wilmot John and Wilmot Darleen Marie
Similar Homes in Nashua, NH
Create a Home Valuation Report for This Property
The Home Valuation Report is an in-depth analysis detailing your home's value as well as a comparison with similar homes in the area
Home Values in the Area
Average Home Value in this Area
Purchase History
| Date | Type | Sale Price | Title Company |
|---|---|---|---|
| Quit Claim Deed | -- | None Available | |
| Quit Claim Deed | -- | None Available | |
| Not Resolvable | $270,000 | -- | |
| Quit Claim Deed | -- | -- | |
| Quit Claim Deed | -- | -- | |
| Warranty Deed | $220,000 | -- | |
| Deed | $143,100 | -- | |
| Foreclosure Deed | $129,500 | -- | |
| Deed | $240,000 | -- | |
| Deed | $180,000 | -- | |
| Warranty Deed | $125,000 | -- | |
| Quit Claim Deed | -- | -- | |
| Warranty Deed | $220,000 | -- | |
| Deed | $143,100 | -- | |
| Foreclosure Deed | $129,500 | -- | |
| Deed | $240,000 | -- | |
| Deed | $180,000 | -- | |
| Warranty Deed | $125,000 | -- |
Source: Public Records
Mortgage History
| Date | Status | Loan Amount | Loan Type |
|---|---|---|---|
| Open | $190,000 | New Conventional | |
| Closed | $190,000 | Stand Alone Refi Refinance Of Original Loan | |
| Previous Owner | $170,000 | Unknown |
Source: Public Records
Property History
| Date | Event | Price | Change | Sq Ft Price |
|---|---|---|---|---|
| 04/28/2017 04/28/17 | Sold | $270,000 | +8.0% | $166 / Sq Ft |
| 03/06/2017 03/06/17 | Pending | -- | -- | -- |
| 03/02/2017 03/02/17 | For Sale | $250,000 | +13.6% | $154 / Sq Ft |
| 07/26/2013 07/26/13 | Sold | $220,000 | -5.2% | $128 / Sq Ft |
| 06/06/2013 06/06/13 | Pending | -- | -- | -- |
| 05/15/2013 05/15/13 | Price Changed | $232,000 | -5.3% | $135 / Sq Ft |
| 04/09/2013 04/09/13 | For Sale | $244,900 | 0.0% | $142 / Sq Ft |
| 04/04/2013 04/04/13 | Pending | -- | -- | -- |
| 03/08/2013 03/08/13 | For Sale | $244,900 | -- | $142 / Sq Ft |
Source: MLS Property Information Network (MLS PIN)
Tax History Compared to Growth
Tax History
| Year | Tax Paid | Tax Assessment Tax Assessment Total Assessment is a certain percentage of the fair market value that is determined by local assessors to be the total taxable value of land and additions on the property. | Land | Improvement |
|---|---|---|---|---|
| 2023 | $6,326 | $347,000 | $123,300 | $223,700 |
| 2022 | $6,270 | $347,000 | $123,300 | $223,700 |
| 2021 | $5,798 | $249,700 | $86,300 | $163,400 |
| 2020 | $5,653 | $250,000 | $86,300 | $163,700 |
| 2019 | $5,440 | $250,000 | $86,300 | $163,700 |
| 2018 | $5,303 | $250,000 | $86,300 | $163,700 |
| 2017 | $5,019 | $194,600 | $69,800 | $124,800 |
| 2016 | $4,879 | $194,600 | $69,800 | $124,800 |
| 2015 | $4,774 | $194,600 | $69,800 | $124,800 |
| 2014 | $4,680 | $194,600 | $69,800 | $124,800 |
Source: Public Records
Agents Affiliated with this Home
-
Seller's Agent in 2017
Susan Monette
Compass
(978) 857-7034
121 Total Sales
-
K
Buyer's Agent in 2017
Kathy Cronin
Gibson Sotheby's International Realty
-
Seller's Agent in 2013
Arlene Hajjar
Better Homes and Gardens Real Estate - The Masiello Group
(603) 490-1001
43 Total Sales
Map
Source: MLS Property Information Network (MLS PIN)
MLS Number: 71491379
APN: NASH-000000-000000-000488A
Disclaimer: Certain information contained herein is derived from information provided by parties other than Homes.com. All information provided is deemed reliable, but is not guaranteed to be accurate and should be independently verified.
![]() The property listing data and information, or the Images, set forth herein were provided to MLS Property Information Network, Inc. from third party sources, including sellers, lessors and public records, and were compiled by MLS Property Information Network, Inc. The property listing data and information, and the Images, are for the personal, non-commercial use of consumers having a good faith interest in purchasing or leasing listed properties of the type displayed to them and may not be used for any purpose other than to identify prospective properties which such consumers may have a good faith interest in purchasing or leasing. MLS Property Information Network, Inc. and its subscribers disclaim any and all representations and warranties as to the accuracy of the property listing data and information, or as to the accuracy of any of the Images, set forth herein.
The property listing data and information, or the Images, set forth herein were provided to MLS Property Information Network, Inc. from third party sources, including sellers, lessors and public records, and were compiled by MLS Property Information Network, Inc. The property listing data and information, and the Images, are for the personal, non-commercial use of consumers having a good faith interest in purchasing or leasing listed properties of the type displayed to them and may not be used for any purpose other than to identify prospective properties which such consumers may have a good faith interest in purchasing or leasing. MLS Property Information Network, Inc. and its subscribers disclaim any and all representations and warranties as to the accuracy of the property listing data and information, or as to the accuracy of any of the Images, set forth herein.
Nearby Homes
- 98 Appleside Dr
- 160 Daniel Webster Hwy Unit 331
- 160 Daniel Webster Hwy Unit 102
- 3 March St
- 2 Autumn Leaf Dr Unit 15
- 9 Louisburg Square Unit 2
- 7 Louisburg Square Unit 5
- 7 Louisburg Square Unit 8
- 113 Bluestone Dr
- 21 Partridge Cir
- 5 Dryden Ave
- 12 Dracut Rd
- 23 Massachusetts Dr
- 127 Peele Rd
- 29 Chalifoux Rd
- 16 Amble Rd
- 9 Orchard Ave Unit 11
- 5 Rhode Island Ave
- 1 Hayden St
- 32 Lynn St