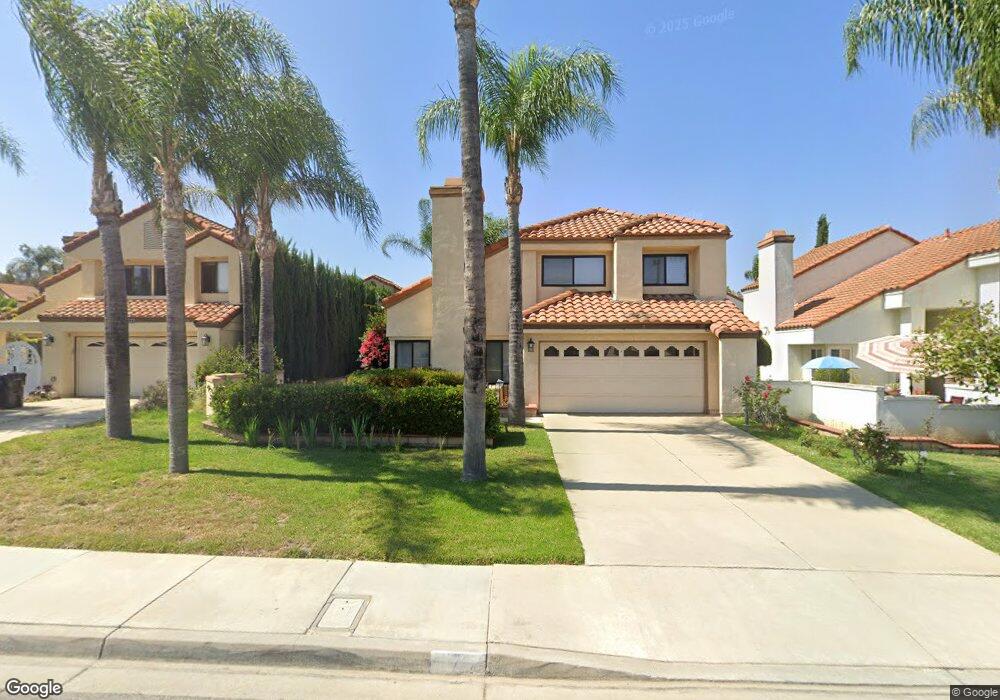
7 Ravencrest Cir Pomona, CA 91766
Estimated Value: $940,893 - $1,014,000
3
Beds
3
Baths
2,045
Sq Ft
$478/Sq Ft
Est. Value
About This Home
This home is located at 7 Ravencrest Cir, Pomona, CA 91766 and is currently estimated at $977,723, approximately $478 per square foot. 7 Ravencrest Cir is a home located in Los Angeles County with nearby schools including Ranch Hills Elementary, Lorbeer Middle School, and Diamond Ranch High School.
Ownership History
Date
Name
Owned For
Owner Type
Purchase Details
Closed on
Jan 14, 2021
Sold by
Parameswaran Sreekumar and Gangadharan Sreekumar Parameswaran
Bought by
Gangadharan Sreekumar Parameswaran and Gangadharan Saraswathy Sindhu
Current Estimated Value
Home Financials for this Owner
Home Financials are based on the most recent Mortgage that was taken out on this home.
Original Mortgage
$268,000
Outstanding Balance
$151,558
Interest Rate
2.6%
Mortgage Type
New Conventional
Estimated Equity
$826,165
Purchase Details
Closed on
Jan 22, 2010
Sold by
Dougherty Thomas L and Dougherty Judy L
Bought by
Parameswaran Pg Sreekumar and Parameswaran Saraswathy Sindhu
Home Financials for this Owner
Home Financials are based on the most recent Mortgage that was taken out on this home.
Original Mortgage
$402,000
Interest Rate
4.97%
Mortgage Type
New Conventional
Purchase Details
Closed on
Aug 19, 2006
Sold by
Dougherty Thomas L and Dougherty Judy L
Bought by
Douherty Thomas L and Dougherty Judy L
Create a Home Valuation Report for This Property
The Home Valuation Report is an in-depth analysis detailing your home's value as well as a comparison with similar homes in the area
Home Values in the Area
Average Home Value in this Area
Purchase History
| Date | Buyer | Sale Price | Title Company |
|---|---|---|---|
| Gangadharan Sreekumar Parameswaran | -- | Bnt Title Company Of Ca | |
| Parameswaran Pg Sreekumar | $480,000 | Act | |
| Douherty Thomas L | -- | None Available |
Source: Public Records
Mortgage History
| Date | Status | Borrower | Loan Amount |
|---|---|---|---|
| Open | Gangadharan Sreekumar Parameswaran | $268,000 | |
| Previous Owner | Parameswaran Pg Sreekumar | $402,000 |
Source: Public Records
Tax History Compared to Growth
Tax History
| Year | Tax Paid | Tax Assessment Tax Assessment Total Assessment is a certain percentage of the fair market value that is determined by local assessors to be the total taxable value of land and additions on the property. | Land | Improvement |
|---|---|---|---|---|
| 2025 | $7,962 | $619,582 | $242,539 | $377,043 |
| 2024 | $7,962 | $607,434 | $237,784 | $369,650 |
| 2023 | $7,808 | $595,524 | $233,122 | $362,402 |
| 2022 | $7,692 | $583,848 | $228,551 | $355,297 |
| 2021 | $7,522 | $572,401 | $224,070 | $348,331 |
| 2020 | $7,499 | $566,533 | $221,773 | $344,760 |
| 2019 | $7,690 | $555,425 | $217,425 | $338,000 |
| 2018 | $7,163 | $544,535 | $213,162 | $331,373 |
| 2016 | $6,736 | $523,392 | $204,886 | $318,506 |
| 2015 | $6,680 | $515,531 | $201,809 | $313,722 |
| 2014 | $6,631 | $505,433 | $197,856 | $307,577 |
Source: Public Records
Map
Nearby Homes
- 15 Ravencrest Cir
- 1 Country Wood Dr
- 30 Country Wood Dr
- 46 Country Wood Dr
- 49 Stagecoach Dr
- 23 Country Ridge Rd
- 35 Old Wood Rd
- 25 Franciscan Place
- 51 Rolling Hills Dr
- 15 Greensboro Ct
- 8 Vista Ct
- 54 Falcon Ridge Dr
- 53 Cottontail Dr
- 32 Franciscan Place
- 14 Calle Del Cabos
- 18 Calle Del Rodeo
- 760 Featherwood Dr
- 19 Viewpoint Cir
- 55 Los Coyotes Dr
- 26 Blackbird Ln
- 5 Ravencrest Cir
- 9 Ravencrest Cir
- 3 Ravencrest Cir
- 8 Willowbrook Ln
- 6 Willowbrook Ln
- 10 Willowbrook Ln
- 11 Ravencrest Cir
- 4 Willowbrook Ln
- 12 Willowbrook Ln
- 8 Ravencrest Cir
- 1 Ravencrest Cir
- 6 Ravencrest Cir
- 10 Ravencrest Cir
- 4 Ravencrest Cir
- 2 Willowbrook Ln
- 14 Willowbrook Ln
- 14 Ravencrest Cir
- 12 Ravencrest Cir
- 2 Ravencrest Cir
- 2 Chaparral Dr