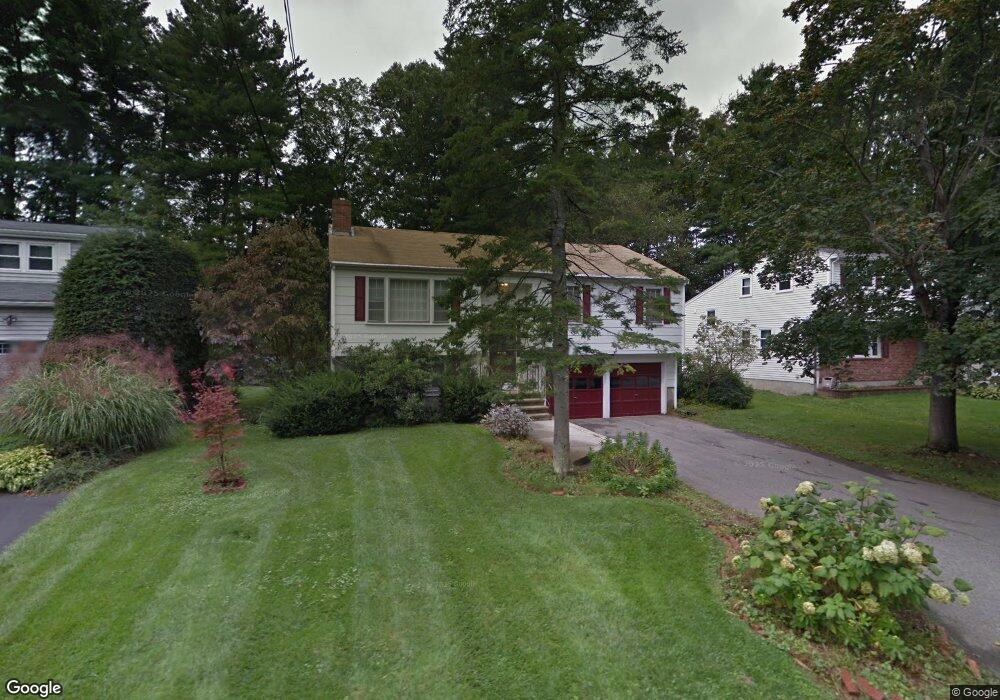
7 Salvi Dr Framingham, MA 01701
Nobscot NeighborhoodEstimated Value: $618,000 - $743,000
3
Beds
3
Baths
1,700
Sq Ft
$393/Sq Ft
Est. Value
About This Home
This home is located at 7 Salvi Dr, Framingham, MA 01701 and is currently estimated at $667,414, approximately $392 per square foot. 7 Salvi Dr is a home located in Middlesex County with nearby schools including Framingham High School, MetroWest Jewish Day School, and Saint Bridget School.
Ownership History
Date
Name
Owned For
Owner Type
Purchase Details
Closed on
Jan 20, 2015
Sold by
Kounadis Ft and Kounadis
Bought by
Kounadis Irt and Kounadis
Current Estimated Value
Purchase Details
Closed on
Jan 13, 2005
Sold by
Kounadis Costas and Kounadis Parthena
Bought by
Kounadis Ft and Kounadis
Purchase Details
Closed on
Jan 29, 2001
Sold by
Kounadis Timothy E and Kounadis Kelley D
Bought by
Kounadis Costas and Kounadis Parthena
Purchase Details
Closed on
Jun 27, 1991
Sold by
Douglas Harry and Douglas Elaine
Bought by
Kounadis Costas and Kounadis Parthena
Home Financials for this Owner
Home Financials are based on the most recent Mortgage that was taken out on this home.
Original Mortgage
$90,000
Interest Rate
9.44%
Mortgage Type
Purchase Money Mortgage
Create a Home Valuation Report for This Property
The Home Valuation Report is an in-depth analysis detailing your home's value as well as a comparison with similar homes in the area
Home Values in the Area
Average Home Value in this Area
Purchase History
We collect this data history from publicly available records. To have your information removed, we recommend requesting removal directly through your county’s website.
| Date | Buyer | Sale Price | Title Company |
|---|---|---|---|
| Kounadis Irt | -- | -- | |
| Kounadis Irt | -- | -- | |
| Kounadis Ft | -- | -- | |
| Kounadis Ft | -- | -- | |
| Kounadis Costas | $300,000 | -- | |
| Kounadis Costas | $153,500 | -- | |
| Kounadis Costas | $153,500 | -- |
Source: Public Records
Mortgage History
We collect this data history from publicly available records. To have your information removed, we recommend requesting removal directly through your county’s website.
| Date | Status | Borrower | Loan Amount |
|---|---|---|---|
| Previous Owner | Kounadis Costas | $93,500 | |
| Previous Owner | Kounadis Costas | $90,000 |
Source: Public Records
Tax History
| Year | Tax Paid | Tax Assessment Tax Assessment Total Assessment is a certain percentage of the fair market value that is determined by local assessors to be the total taxable value of land and additions on the property. | Land | Improvement |
|---|---|---|---|---|
| 2025 | $6,732 | $563,800 | $259,100 | $304,700 |
| 2024 | $6,317 | $507,000 | $231,400 | $275,600 |
| 2023 | $5,956 | $455,000 | $206,500 | $248,500 |
| 2022 | $5,699 | $414,800 | $187,400 | $227,400 |
| 2021 | $5,626 | $400,400 | $180,100 | $220,300 |
| 2020 | $5,568 | $371,700 | $163,700 | $208,000 |
| 2019 | $5,524 | $359,200 | $163,700 | $195,500 |
| 2018 | $5,436 | $333,100 | $157,600 | $175,500 |
| 2017 | $5,284 | $316,200 | $153,000 | $163,200 |
| 2016 | $5,184 | $298,300 | $153,000 | $145,300 |
| 2015 | $5,212 | $292,500 | $152,600 | $139,900 |
Source: Public Records
Map
Nearby Homes
- 350 Central St
- 15 Fenway Dr
- 7 Edith Rd
- 83 Nicholas Rd Unit D
- 94 Spruce St
- 88 Elm St
- 7 Ballydrain Rd
- 19 Chestnut St
- 24 Chestnut St Unit 2
- 61 Indian Head Rd
- 22 Leonard Rd
- 915 Edgell Rd Unit 61
- 106 Danforth St
- 477 Edgell Rd
- 18 Griffin Rd
- 62 Hemenway Rd
- 164 Lockland Ave
- 109 Hastings St
- 210 School St
- 5 Green Ln Unit 5
Your Personal Tour Guide
Ask me questions while you tour the home.