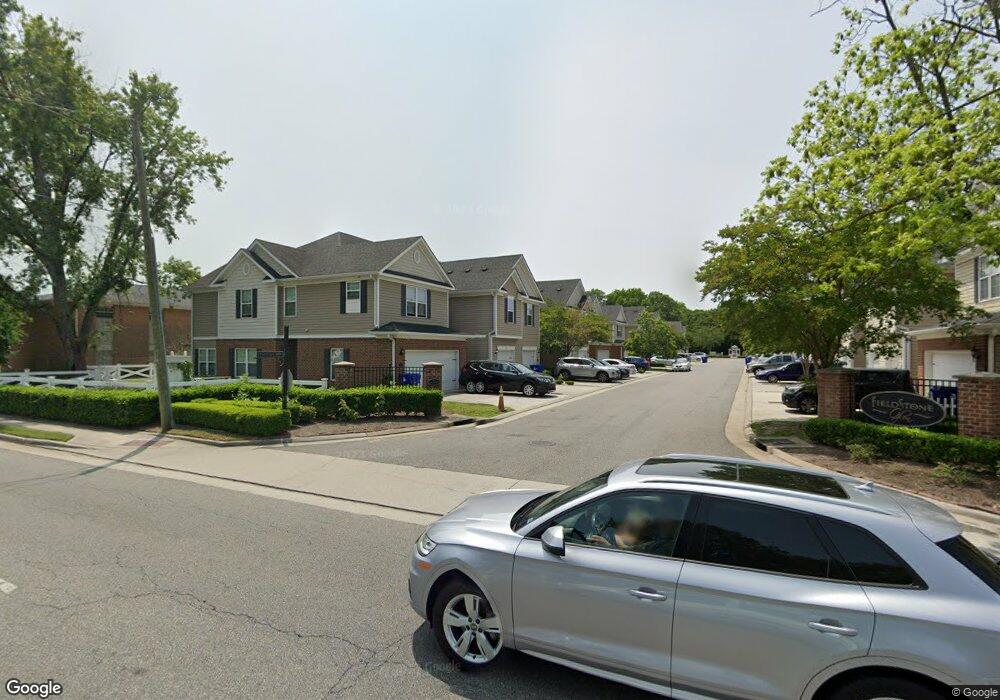
7 Stratum Way Unit 7 Hampton, VA 23661
Briarfield NeighborhoodEstimated Value: $245,000 - $256,461
3
Beds
3
Baths
1,454
Sq Ft
$172/Sq Ft
Est. Value
About This Home
This home is located at 7 Stratum Way Unit 7, Hampton, VA 23661 and is currently estimated at $250,115, approximately $172 per square foot. 7 Stratum Way Unit 7 is a home located in Hampton City with nearby schools including Aberdeen Elementary School, C. Alton Lindsay Middle School, and Hampton High School.
Ownership History
Date
Name
Owned For
Owner Type
Purchase Details
Closed on
Oct 7, 2021
Sold by
Gittens Quinton J
Bought by
Sully Emerald
Current Estimated Value
Home Financials for this Owner
Home Financials are based on the most recent Mortgage that was taken out on this home.
Original Mortgage
$189,150
Outstanding Balance
$174,155
Interest Rate
3.49%
Mortgage Type
New Conventional
Estimated Equity
$75,960
Purchase Details
Closed on
Sep 14, 2017
Sold by
Liggins Joy C
Bought by
Gittens Quinton J
Home Financials for this Owner
Home Financials are based on the most recent Mortgage that was taken out on this home.
Original Mortgage
$169,569
Interest Rate
3.89%
Mortgage Type
VA
Purchase Details
Closed on
Sep 28, 2012
Sold by
Platinum Homes Inc
Bought by
Liggins Joy C
Home Financials for this Owner
Home Financials are based on the most recent Mortgage that was taken out on this home.
Original Mortgage
$157,102
Interest Rate
4.4%
Mortgage Type
FHA
Create a Home Valuation Report for This Property
The Home Valuation Report is an in-depth analysis detailing your home's value as well as a comparison with similar homes in the area
Home Values in the Area
Average Home Value in this Area
Purchase History
| Date | Buyer | Sale Price | Title Company |
|---|---|---|---|
| Sully Emerald | $195,000 | Alpha1 Title & Escrow Llc | |
| Gittens Quinton J | $166,000 | Landmark Title Llc | |
| Liggins Joy C | $160,000 | -- |
Source: Public Records
Mortgage History
| Date | Status | Borrower | Loan Amount |
|---|---|---|---|
| Open | Sully Emerald | $189,150 | |
| Previous Owner | Gittens Quinton J | $169,569 | |
| Previous Owner | Liggins Joy C | $157,102 |
Source: Public Records
Tax History
| Year | Tax Paid | Tax Assessment Tax Assessment Total Assessment is a certain percentage of the fair market value that is determined by local assessors to be the total taxable value of land and additions on the property. | Land | Improvement |
|---|---|---|---|---|
| 2025 | $2,834 | $234,600 | $40,000 | $194,600 |
| 2024 | $2,698 | $234,600 | $40,000 | $194,600 |
| 2023 | $2,552 | $220,000 | $40,000 | $180,000 |
| 2022 | $2,391 | $202,600 | $40,000 | $162,600 |
| 2021 | $2,347 | $178,800 | $33,000 | $145,800 |
| 2020 | $2,130 | $171,800 | $33,000 | $138,800 |
| 2019 | $2,065 | $166,500 | $33,000 | $133,500 |
| 2018 | $1,074 | $155,900 | $33,000 | $122,900 |
| 2017 | $1,933 | $0 | $0 | $0 |
| 2016 | $1,933 | $155,900 | $0 | $0 |
| 2015 | $998 | $0 | $0 | $0 |
| 2014 | $2,088 | $160,900 | $38,000 | $122,900 |
Source: Public Records
Map
Nearby Homes
- 17 Northwood Dr
- 28 Butler Dr
- 1027 Barry Ct
- 1036 Randall Ct
- 19 Haley Dr
- 217 Hankins Dr
- 26 Hull Dr
- 34 Joynes Rd
- 205 Hankins Dr
- 52 Rockingham Dr
- 733 Spruce St
- 215 Woodbury Forrest Dr
- 722 Birch Ave
- 122 Big Bethel Rd
- 1119 Gatling Dr
- 117 Pescara Ln
- 212 Woodbury Forrest Dr
- 711 Hemlock Ave
- 732 Vaughan Ave
- 131 Big Bethel Rd
- 7 Stratum Way
- 9 Stratum Way
- 5 Stratum Way
- 11 Stratum Way
- 3 Stratum Way Unit 3
- 3 Stratum Way
- 1 Stratum Way Unit 1
- 1 Stratum Way
- 13 Stratum Way
- 15 Stratum Way
- 701 Aberdeen Rd
- 651 Aberdeen Rd
- 17 Stratum Way
- 8 Stratum Way
- 10 Stratum Way
- 12 Stratum Way
- 6 Stratum Way
- 19 Stratum Way
- 4 Stratum Way
- 14 Stratum Way
Your Personal Tour Guide
Ask me questions while you tour the home.