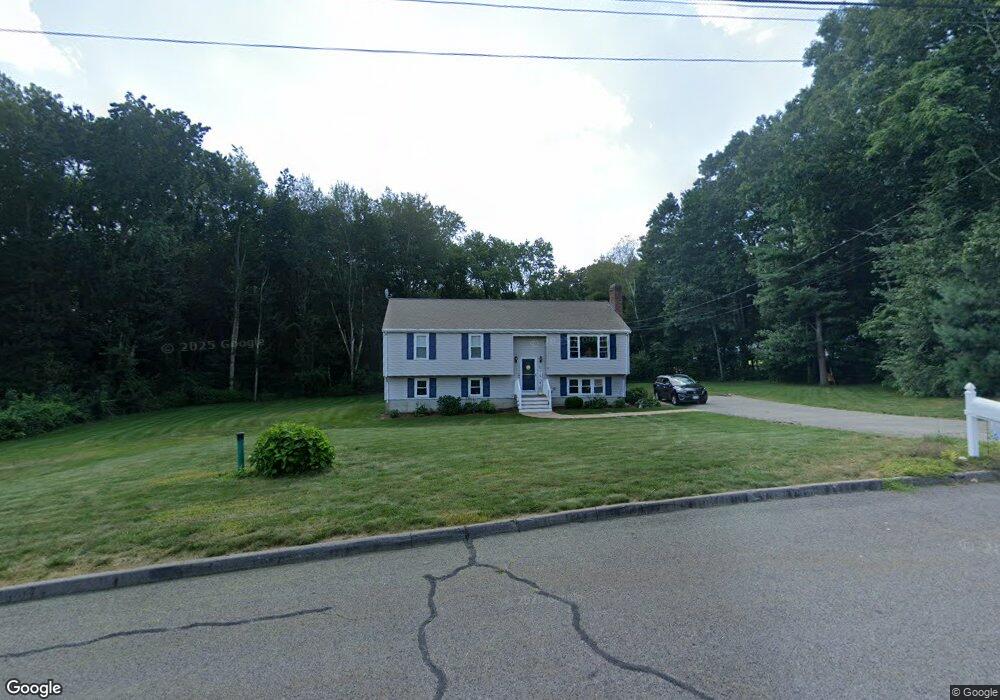
7 Summerfield Rd Walpole, MA 02081
Estimated Value: $655,000 - $784,000
3
Beds
2
Baths
1,182
Sq Ft
$596/Sq Ft
Est. Value
About This Home
This home is located at 7 Summerfield Rd, Walpole, MA 02081 and is currently estimated at $704,325, approximately $595 per square foot. 7 Summerfield Rd is a home located in Norfolk County with nearby schools including Boyden School, Eleanor N. Johnson Middle School, and Walpole High School.
Ownership History
Date
Name
Owned For
Owner Type
Purchase Details
Closed on
Jul 2, 2013
Sold by
Patterson Veronica M and Patterson William J
Bought by
Patterson Steven W and Patterson Jill M
Current Estimated Value
Create a Home Valuation Report for This Property
The Home Valuation Report is an in-depth analysis detailing your home's value as well as a comparison with similar homes in the area
Home Values in the Area
Average Home Value in this Area
Purchase History
| Date | Buyer | Sale Price | Title Company |
|---|---|---|---|
| Patterson Steven W | $350,000 | -- | |
| Patterson Steven W | $350,000 | -- | |
| Patterson Steven W | $350,000 | -- |
Source: Public Records
Mortgage History
| Date | Status | Borrower | Loan Amount |
|---|---|---|---|
| Previous Owner | Patterson Steven W | $120,000 | |
| Previous Owner | Patterson Steven W | $100,000 | |
| Previous Owner | Patterson Steven W | $100,000 | |
| Closed | Patterson Steven W | $0 |
Source: Public Records
Tax History Compared to Growth
Tax History
| Year | Tax Paid | Tax Assessment Tax Assessment Total Assessment is a certain percentage of the fair market value that is determined by local assessors to be the total taxable value of land and additions on the property. | Land | Improvement |
|---|---|---|---|---|
| 2025 | $8,057 | $628,000 | $311,500 | $316,500 |
| 2024 | $7,869 | $595,200 | $299,800 | $295,400 |
| 2023 | $7,491 | $539,300 | $260,700 | $278,600 |
| 2022 | $7,059 | $488,200 | $241,100 | $247,100 |
| 2021 | $6,783 | $457,100 | $227,300 | $229,800 |
| 2020 | $6,737 | $449,400 | $214,700 | $234,700 |
| 2019 | $6,502 | $430,600 | $207,300 | $223,300 |
| 2018 | $6,142 | $402,200 | $197,700 | $204,500 |
| 2017 | $5,942 | $387,600 | $190,300 | $197,300 |
| 2016 | $5,809 | $373,300 | $185,100 | $188,200 |
| 2015 | $5,548 | $353,400 | $177,600 | $175,800 |
| 2014 | $5,273 | $334,600 | $177,600 | $157,000 |
Source: Public Records
Map
Nearby Homes
- 375 Winter St
- 16R Eldor Dr
- 1648 Main St
- 43 Chandler Ave
- 1549 Washington St Unit A
- 7 Hill St Unit 10
- 71 Pond St
- 533 Lincoln Rd
- 1391 Main St Unit 304
- 1391 Main St Unit 208
- 1391 Main St Unit 305
- 1391 Main St Unit 308
- 13 Sandtrap Cir Unit 14
- 11 Sandtrap Cir Unit 15
- 20 Sandtrap Cir Unit 4
- 18 Sandtrap Cir Unit 3
- 17 Sandtrap Cir Unit 12
- 15 Sandtrap Cir Unit 13
- 14 Tiger Terrace Unit 29
- 10 Sandtrap Cir Unit 2