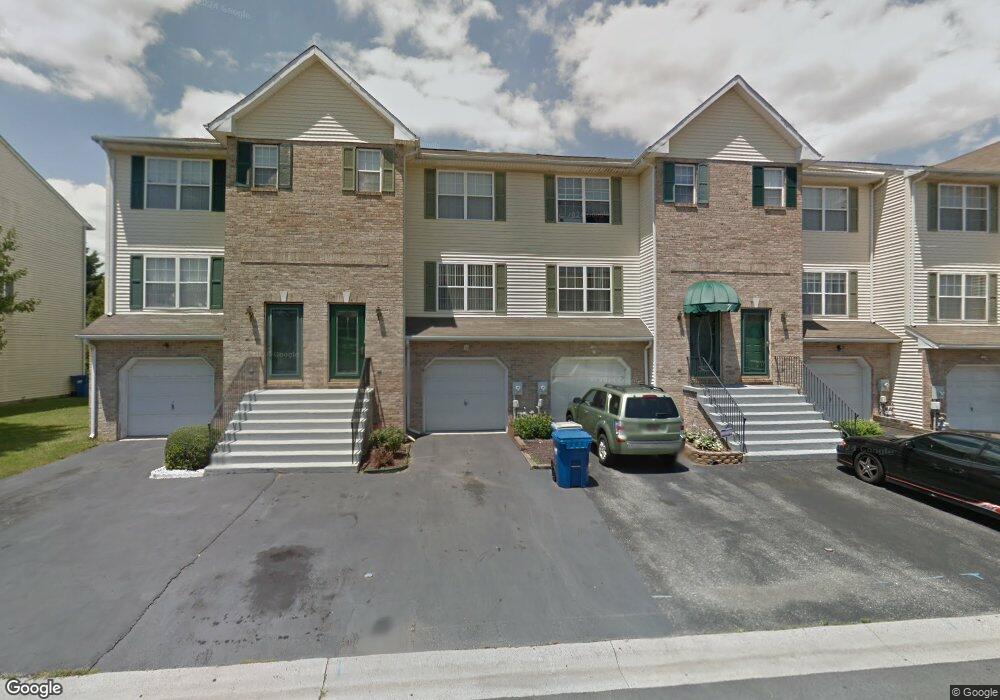
7 Vista Ct New Castle, DE 19720
Estimated Value: $283,463 - $313,000
2
Beds
2
Baths
1,424
Sq Ft
$207/Sq Ft
Est. Value
About This Home
This home is located at 7 Vista Ct, New Castle, DE 19720 and is currently estimated at $295,116, approximately $207 per square foot. 7 Vista Ct is a home located in New Castle County with nearby schools including Kathleen H. Wilbur Elementary School, Gunning Bedford Middle School, and Fairwinds Christian School.
Ownership History
Date
Name
Owned For
Owner Type
Purchase Details
Closed on
Mar 30, 2007
Sold by
Greenfield Brent M
Bought by
Tibuah Charles K and Fordwuo Elizabeth
Current Estimated Value
Home Financials for this Owner
Home Financials are based on the most recent Mortgage that was taken out on this home.
Original Mortgage
$205,000
Outstanding Balance
$124,629
Interest Rate
6.25%
Mortgage Type
Purchase Money Mortgage
Estimated Equity
$170,487
Purchase Details
Closed on
Jul 24, 2003
Sold by
Rawls Kyle T and Kennerly Rawls Tiyeast B
Bought by
Greenfield Brent
Home Financials for this Owner
Home Financials are based on the most recent Mortgage that was taken out on this home.
Original Mortgage
$126,996
Interest Rate
5.28%
Mortgage Type
FHA
Create a Home Valuation Report for This Property
The Home Valuation Report is an in-depth analysis detailing your home's value as well as a comparison with similar homes in the area
Home Values in the Area
Average Home Value in this Area
Purchase History
| Date | Buyer | Sale Price | Title Company |
|---|---|---|---|
| Tibuah Charles K | $205,000 | None Available | |
| Greenfield Brent | $64,000 | -- |
Source: Public Records
Mortgage History
| Date | Status | Borrower | Loan Amount |
|---|---|---|---|
| Open | Tibuah Charles K | $205,000 | |
| Previous Owner | Greenfield Brent | $126,996 | |
| Closed | Greenfield Brent | $5,079 |
Source: Public Records
Tax History Compared to Growth
Tax History
| Year | Tax Paid | Tax Assessment Tax Assessment Total Assessment is a certain percentage of the fair market value that is determined by local assessors to be the total taxable value of land and additions on the property. | Land | Improvement |
|---|---|---|---|---|
| 2024 | $1,176 | $48,200 | $7,400 | $40,800 |
| 2023 | $1,034 | $48,200 | $7,400 | $40,800 |
| 2022 | $1,096 | $48,200 | $7,400 | $40,800 |
| 2021 | $1,195 | $48,200 | $7,400 | $40,800 |
| 2020 | $1,205 | $48,200 | $7,400 | $40,800 |
| 2019 | $1,536 | $48,200 | $7,400 | $40,800 |
| 2018 | $1,179 | $48,200 | $7,400 | $40,800 |
| 2017 | $1,080 | $48,200 | $7,400 | $40,800 |
| 2016 | $1,318 | $48,200 | $7,400 | $40,800 |
| 2015 | $1,319 | $48,200 | $7,400 | $40,800 |
| 2014 | $1,326 | $48,200 | $7,400 | $40,800 |
Source: Public Records
Map
Nearby Homes
- 5 Liborio Ln
- 68 Liborio Ln
- 237 Shetland Dr
- 1209 Canvasback Dr
- 203 Shorewind Rd
- 734 Pulaski Hwy Unit 30
- 6 Harpers Place
- 20 Dorsey Ln
- 12 Bancroft Rd
- 719 Cardinal Ave
- 120 Channing Dr
- 13 Denise Ct
- 104 Channing Dr
- 24 Ashley Dr
- 207 Rolling Green Ave
- 201 Dasher Ct
- 7 Brian Ct
- 1098 Old Forge Rd
- 28 Paxton Ln
- 410 Ashton Ln