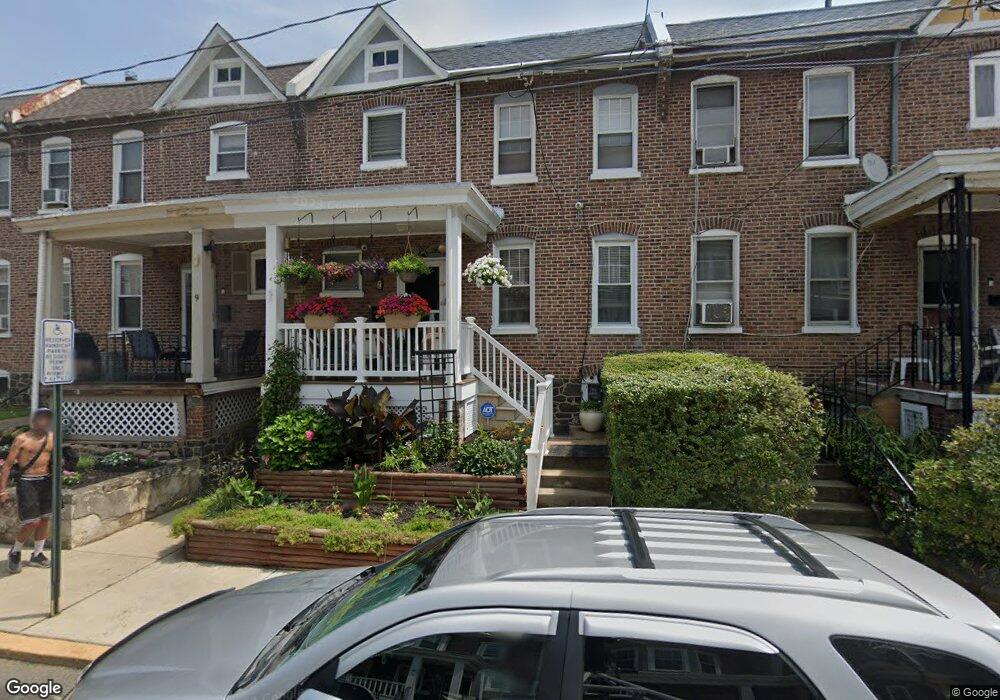
7 W 26th St Wilmington, DE 19802
North Brandywine NeighborhoodEstimated Value: $139,000 - $206,000
3
Beds
1
Bath
1,334
Sq Ft
$126/Sq Ft
Est. Value
About This Home
This home is located at 7 W 26th St, Wilmington, DE 19802 and is currently estimated at $167,667, approximately $125 per square foot. 7 W 26th St is a home with nearby schools including Evan G. Shortlidge Academy, The John Dickinson School, and Skyline Middle School.
Ownership History
Date
Name
Owned For
Owner Type
Purchase Details
Closed on
Aug 18, 2014
Sold by
Collins Stacey L
Bought by
Collins Stacey L and Collins Marylyn A
Current Estimated Value
Purchase Details
Closed on
Aug 18, 2003
Sold by
Conlon Sara E
Bought by
Collins Stacey L
Home Financials for this Owner
Home Financials are based on the most recent Mortgage that was taken out on this home.
Original Mortgage
$43,098
Outstanding Balance
$18,840
Interest Rate
5.52%
Mortgage Type
FHA
Estimated Equity
$148,827
Create a Home Valuation Report for This Property
The Home Valuation Report is an in-depth analysis detailing your home's value as well as a comparison with similar homes in the area
Home Values in the Area
Average Home Value in this Area
Purchase History
| Date | Buyer | Sale Price | Title Company |
|---|---|---|---|
| Collins Stacey L | -- | None Available | |
| Collins Stacey L | $43,000 | -- |
Source: Public Records
Mortgage History
| Date | Status | Borrower | Loan Amount |
|---|---|---|---|
| Open | Collins Stacey L | $43,098 |
Source: Public Records
Tax History Compared to Growth
Tax History
| Year | Tax Paid | Tax Assessment Tax Assessment Total Assessment is a certain percentage of the fair market value that is determined by local assessors to be the total taxable value of land and additions on the property. | Land | Improvement |
|---|---|---|---|---|
| 2024 | $849 | $27,200 | $3,500 | $23,700 |
| 2023 | $738 | $27,200 | $3,500 | $23,700 |
| 2022 | $741 | $27,200 | $3,500 | $23,700 |
| 2021 | $543 | $27,200 | $3,500 | $23,700 |
| 2020 | $543 | $27,200 | $3,500 | $23,700 |
| 2019 | $543 | $27,200 | $3,500 | $23,700 |
| 2018 | $741 | $27,200 | $3,500 | $23,700 |
| 2017 | $739 | $27,200 | $3,500 | $23,700 |
| 2016 | $701 | $27,200 | $3,500 | $23,700 |
| 2015 | $505 | $27,200 | $3,500 | $23,700 |
| 2014 | $505 | $27,200 | $3,500 | $23,700 |
Source: Public Records
Map
Nearby Homes
- 2616 N Tatnall St
- 2704 N Tatnall St
- 2708 N Tatnall St
- 2714 Enterprise St
- 118 W 26th St
- 2505 N Market St
- 2621 N West St
- 202 W 26th St
- 2717 N West St
- 2507 Carter St
- 9 E 24th St
- 11 E 24th St
- 2413 N West St
- 2714 N Washington St
- 107 E 28th St
- 205 E 25th St
- 2401 Carter St
- 2314 N Market St
- 26 E 24th St
- 101 W 23rd St