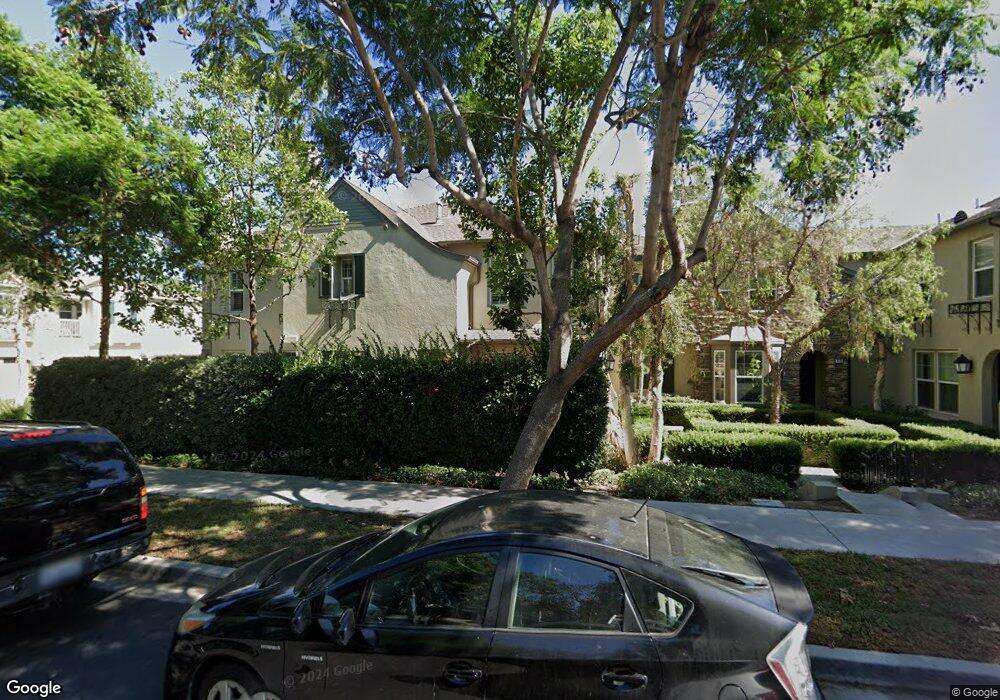
7 Walbert Ln Unit 23 Ladera Ranch, CA 92694
Estimated Value: $946,000 - $1,218,000
3
Beds
2
Baths
1,801
Sq Ft
$566/Sq Ft
Est. Value
About This Home
This home is located at 7 Walbert Ln Unit 23, Ladera Ranch, CA 92694 and is currently estimated at $1,019,784, approximately $566 per square foot. 7 Walbert Ln Unit 23 is a home located in Orange County with nearby schools including Ladera Ranch Elementary School, Ladera Ranch Middle School, and San Juan Hills High School.
Ownership History
Date
Name
Owned For
Owner Type
Purchase Details
Closed on
Aug 31, 2005
Sold by
Jones Jeffrey and Jones Kimberly
Bought by
Drechsler Michael D and Lauren Tammy
Current Estimated Value
Home Financials for this Owner
Home Financials are based on the most recent Mortgage that was taken out on this home.
Original Mortgage
$124,600
Outstanding Balance
$66,116
Interest Rate
5.72%
Mortgage Type
Credit Line Revolving
Estimated Equity
$953,668
Purchase Details
Closed on
Jun 9, 2005
Sold by
Malz Kimberly A
Bought by
Jones Jeffery and Jones Kimberly
Purchase Details
Closed on
Jul 21, 2003
Sold by
Shea Homes Lp
Bought by
Malz Kimberly A
Home Financials for this Owner
Home Financials are based on the most recent Mortgage that was taken out on this home.
Original Mortgage
$316,200
Interest Rate
6.12%
Mortgage Type
Purchase Money Mortgage
Create a Home Valuation Report for This Property
The Home Valuation Report is an in-depth analysis detailing your home's value as well as a comparison with similar homes in the area
Home Values in the Area
Average Home Value in this Area
Purchase History
| Date | Buyer | Sale Price | Title Company |
|---|---|---|---|
| Drechsler Michael D | $623,000 | First American Title Co | |
| Jones Jeffery | -- | -- | |
| Malz Kimberly A | $395,500 | Chicago Title Co |
Source: Public Records
Mortgage History
| Date | Status | Borrower | Loan Amount |
|---|---|---|---|
| Open | Drechsler Michael D | $124,600 | |
| Previous Owner | Malz Kimberly A | $316,200 |
Source: Public Records
Tax History
| Year | Tax Paid | Tax Assessment Tax Assessment Total Assessment is a certain percentage of the fair market value that is determined by local assessors to be the total taxable value of land and additions on the property. | Land | Improvement |
|---|---|---|---|---|
| 2025 | $11,155 | $851,372 | $501,358 | $350,014 |
| 2024 | $11,155 | $834,679 | $491,528 | $343,151 |
| 2023 | $10,954 | $818,313 | $481,890 | $336,423 |
| 2022 | $9,159 | $618,340 | $349,103 | $269,237 |
| 2021 | $8,981 | $606,216 | $342,258 | $263,958 |
| 2020 | $8,861 | $600,000 | $338,748 | $261,252 |
| 2019 | $8,850 | $600,000 | $338,748 | $261,252 |
| 2018 | $8,946 | $600,000 | $338,748 | $261,252 |
| 2017 | $8,587 | $560,000 | $298,748 | $261,252 |
| 2016 | $8,208 | $522,000 | $260,748 | $261,252 |
| 2015 | $8,347 | $522,000 | $260,748 | $261,252 |
| 2014 | $7,766 | $459,425 | $198,173 | $261,252 |
Source: Public Records
Map
Nearby Homes
- 23 Aryshire Ln
- 9 Baudin Cir
- 10 Roycroft Ct
- 9 St Steven Ct
- 9 Flowerdale
- 55 Fieldhouse
- 346 Hazel Dr
- 18811 Volta Rd
- 5104 Solace Dr
- 15 Whitworth St
- 1 Shelburne St
- 8 Fern Haven Farm
- 72 Sellas Rd N
- 30 Savannah Ln
- 25 Amy Way
- 81 Zinnia St
- 5 Lynde St Unit 28
- 40 Three Vines Ct Unit 1601
- 30 Marcilla Unit 63
- 11 Oatfield Farm
- 2 Walbert Ln Unit 24
- 9 Walbert Ln
- 11 Walbert Ln
- 17 Walbert Ln
- 21 Walbert Ln
- 29 Walbert Ln
- 31 Walbert Ln
- 30 Walbert Ln Unit 18
- 25 Walbert Ln Unit 15
- 33 Walbert Ln
- 35 Walbert Ln
- 39 Walbert Ln
- 41 Walbert Ln
- 43 Walbert Ln
- 45 Walbert Ln
- 47 Walbert Ln Unit 3
- 48 Walbert Ln
- 47 Walbert Ln
- 51 Walbert Ln
- 49 Walbert Ln
Your Personal Tour Guide
Ask me questions while you tour the home.