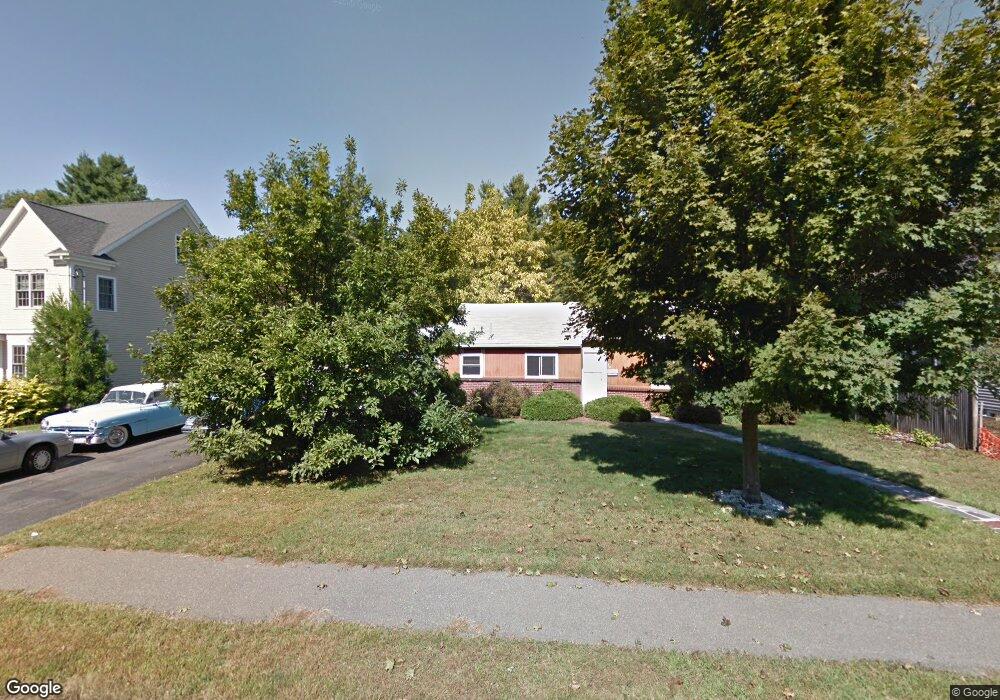
70 Ardmore Rd Needham Heights, MA 02494
Estimated Value: $1,330,000 - $2,487,000
4
Beds
5
Baths
1,903
Sq Ft
$1,076/Sq Ft
Est. Value
About This Home
This home is located at 70 Ardmore Rd, Needham Heights, MA 02494 and is currently estimated at $2,047,070, approximately $1,075 per square foot. 70 Ardmore Rd is a home located in Norfolk County with nearby schools including Eliot Elementary School, High Rock Middle School, and Pollard Middle School.
Ownership History
Date
Name
Owned For
Owner Type
Purchase Details
Closed on
Jan 20, 2015
Sold by
Ardmore Builders Llc
Bought by
Larrabee Rt and Larrabee
Current Estimated Value
Home Financials for this Owner
Home Financials are based on the most recent Mortgage that was taken out on this home.
Original Mortgage
$817,000
Outstanding Balance
$625,816
Interest Rate
3.92%
Mortgage Type
Purchase Money Mortgage
Estimated Equity
$1,421,254
Create a Home Valuation Report for This Property
The Home Valuation Report is an in-depth analysis detailing your home's value as well as a comparison with similar homes in the area
Home Values in the Area
Average Home Value in this Area
Purchase History
| Date | Buyer | Sale Price | Title Company |
|---|---|---|---|
| Larrabee Rt | -- | -- | |
| Larrabee Rt | -- | -- |
Source: Public Records
Mortgage History
| Date | Status | Borrower | Loan Amount |
|---|---|---|---|
| Open | Larrabee Rt | $817,000 | |
| Closed | Larrabee Rt | $817,000 |
Source: Public Records
Tax History
| Year | Tax Paid | Tax Assessment Tax Assessment Total Assessment is a certain percentage of the fair market value that is determined by local assessors to be the total taxable value of land and additions on the property. | Land | Improvement |
|---|---|---|---|---|
| 2025 | $21,953 | $2,071,000 | $767,100 | $1,303,900 |
| 2024 | $22,054 | $1,761,500 | $496,200 | $1,265,300 |
| 2023 | $21,525 | $1,650,700 | $496,200 | $1,154,500 |
| 2022 | $20,687 | $1,547,300 | $444,700 | $1,102,600 |
| 2021 | $20,161 | $1,547,300 | $444,700 | $1,102,600 |
| 2020 | $19,316 | $1,546,500 | $444,700 | $1,101,800 |
| 2019 | $18,502 | $1,493,300 | $405,700 | $1,087,600 |
| 2018 | $17,740 | $1,493,300 | $405,700 | $1,087,600 |
| 2017 | $16,057 | $1,350,500 | $405,700 | $944,800 |
| 2016 | $5,987 | $518,800 | $405,700 | $113,100 |
| 2015 | $5,857 | $518,800 | $405,700 | $113,100 |
| 2014 | $5,261 | $452,000 | $340,700 | $111,300 |
Source: Public Records
Map
Nearby Homes
- 48 Taylor St
- 70 Briarwood Cir
- 345 Central Ave
- 5 Homsy Ln
- 12 Hill St
- 10 Fife Rd
- 212 Central Ave
- 18 Evergreen Rd
- 62 Evelyn Rd
- 140 Hillside Ave
- 140 Hillside Ave Unit a
- 379 Hunnewell St Unit 379
- 132 Hillside Ave
- 134 Hillside Ave Unit 134
- 151 Oakland St
- 32 Lantern Ln
- 181 Saint Mary St
- 187 Saint Mary St
- 96 Washburn Ave
- 36 Eliot Rd
Your Personal Tour Guide
Ask me questions while you tour the home.