70 Ardmore Rd Needham Heights, MA 02494
Needham AreaEstimated Value: $2,050,000 - $2,658,000
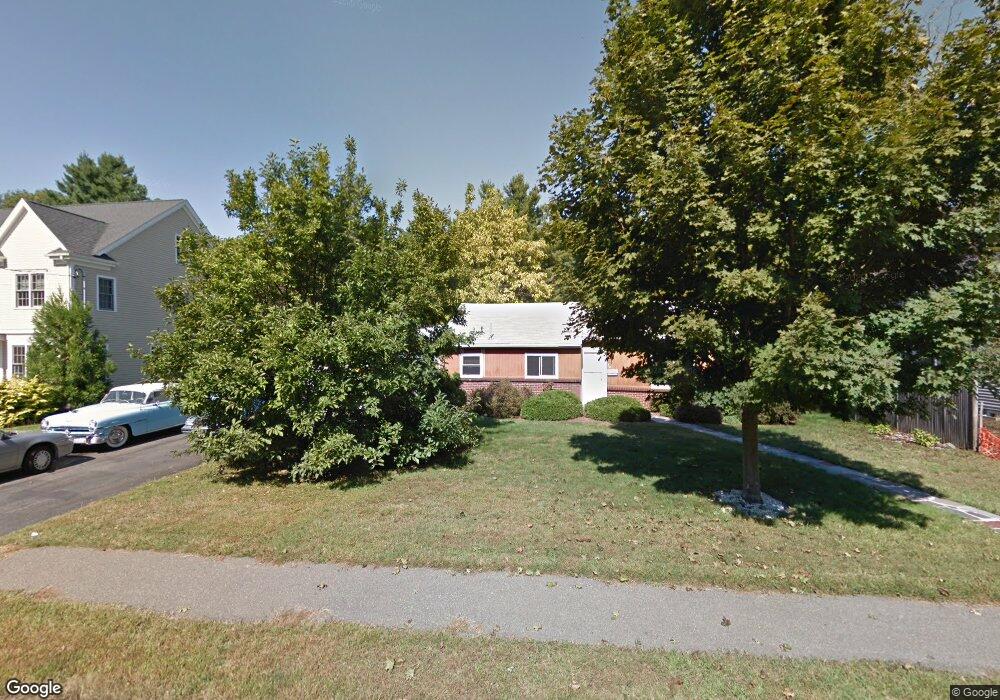
About This Home
This home is located at 70 Ardmore Rd, Needham Heights, MA 02494 and is currently estimated at $2,304,355, approximately $1,210 per square foot. 70 Ardmore Rd is a home located in Norfolk County with nearby schools including Eliot Elementary School, High Rock Middle School, and Pollard Middle School.
Ownership History
We collect this data history from publicly available records. To have your information removed, we recommend requesting removal directly through your county’s website.
Purchase Details
Home Financials for this Owner
Home Financials are based on the most recent Mortgage that was taken out on this home.Purchase Details
Home Values in the Area
Average Home Value in this Area
Purchase History
We collect this data history from publicly available records. To have your information removed, we recommend requesting removal directly through your county’s website.
| Date | Buyer | Sale Price | Title Company |
|---|---|---|---|
| -- | -- | ||
| $690,000 | -- |
Mortgage History
We collect this data history from publicly available records. To have your information removed, we recommend requesting removal directly through your county’s website.
| Date | Status | Borrower | Loan Amount |
|---|---|---|---|
| Open | $817,000 |
Tax History
We collect this data history from publicly available records. To have your information removed, we recommend requesting removal directly through your county’s website.
| Year | Tax Paid | Tax Assessment Tax Assessment Total Assessment is a certain percentage of the fair market value that is determined by local assessors to be the total taxable value of land and additions on the property. | Land | Improvement |
|---|---|---|---|---|
| 2025 | $21,953 | $2,071,000 | $767,100 | $1,303,900 |
| 2024 | $22,054 | $1,761,500 | $496,200 | $1,265,300 |
| 2023 | $21,525 | $1,650,700 | $496,200 | $1,154,500 |
| 2022 | $20,687 | $1,547,300 | $444,700 | $1,102,600 |
| 2021 | $20,161 | $1,547,300 | $444,700 | $1,102,600 |
| 2020 | $19,316 | $1,546,500 | $444,700 | $1,101,800 |
| 2019 | $18,502 | $1,493,300 | $405,700 | $1,087,600 |
| 2018 | $17,740 | $1,493,300 | $405,700 | $1,087,600 |
| 2017 | $16,057 | $1,350,500 | $405,700 | $944,800 |
| 2016 | $5,987 | $518,800 | $405,700 | $113,100 |
| 2015 | $5,857 | $518,800 | $405,700 | $113,100 |
| 2014 | $5,261 | $452,000 | $340,700 | $111,300 |
Map
- 319 Oakland St
- 48 Taylor St
- 6 Ardmore Rd
- 279 Oakland St
- 41 Hunnewell St
- 213 Hunnewell St
- 21 Madison Rd
- 18 Rosegate Rd
- 30 Webster St Unit 4
- 102 Booth St
- 8 Noanett Rd
- 300 Hunnewell St
- 11 Greenough St
- 80 Gary Rd
- 312 Hunnewell St Unit 1
- 4 Park River St
- 178 Webster St
- 23 Yale Rd
- 179 Oakland St
- 6 Willow St
Ask me questions while you tour the home.