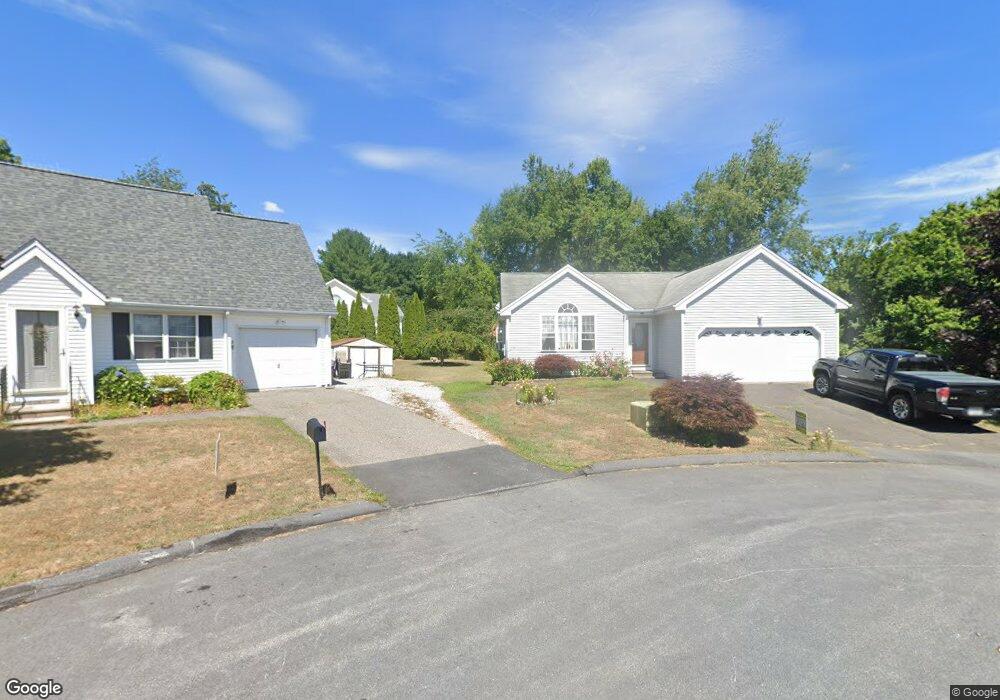
70 Birney Brook Rd Torrington, CT 06790
Estimated Value: $332,000 - $352,000
3
Beds
2
Baths
1,242
Sq Ft
$274/Sq Ft
Est. Value
About This Home
This home is located at 70 Birney Brook Rd, Torrington, CT 06790 and is currently estimated at $340,161, approximately $273 per square foot. 70 Birney Brook Rd is a home located in Litchfield County with nearby schools including Torrington Middle School, Torrington High School, and St. John Paul the Great Academy.
Ownership History
Date
Name
Owned For
Owner Type
Purchase Details
Closed on
Feb 17, 1999
Sold by
Src Const Co
Bought by
Pone Sisavath Rassamy and Pone Khamsouk Boun
Current Estimated Value
Home Financials for this Owner
Home Financials are based on the most recent Mortgage that was taken out on this home.
Original Mortgage
$109,150
Interest Rate
6.75%
Create a Home Valuation Report for This Property
The Home Valuation Report is an in-depth analysis detailing your home's value as well as a comparison with similar homes in the area
Home Values in the Area
Average Home Value in this Area
Purchase History
| Date | Buyer | Sale Price | Title Company |
|---|---|---|---|
| Pone Sisavath Rassamy | $114,900 | -- |
Source: Public Records
Mortgage History
| Date | Status | Borrower | Loan Amount |
|---|---|---|---|
| Open | Pone Sisavath Rassamy | $50,000 | |
| Closed | Pone Sisavath Rassamy | $25,000 | |
| Closed | Pone Sisavath Rassamy | $109,150 |
Source: Public Records
Tax History
| Year | Tax Paid | Tax Assessment Tax Assessment Total Assessment is a certain percentage of the fair market value that is determined by local assessors to be the total taxable value of land and additions on the property. | Land | Improvement |
|---|---|---|---|---|
| 2025 | $8,319 | $216,370 | $37,380 | $178,990 |
| 2024 | $5,476 | $114,160 | $30,550 | $83,610 |
| 2023 | $5,475 | $114,160 | $30,550 | $83,610 |
| 2022 | $5,382 | $114,160 | $30,550 | $83,610 |
| 2021 | $5,271 | $114,160 | $30,550 | $83,610 |
| 2020 | $5,271 | $114,160 | $30,550 | $83,610 |
| 2019 | $5,397 | $116,890 | $33,950 | $82,940 |
| 2018 | $5,397 | $116,890 | $33,950 | $82,940 |
| 2017 | $5,348 | $116,890 | $33,950 | $82,940 |
| 2016 | $5,348 | $116,890 | $33,950 | $82,940 |
| 2015 | $5,348 | $116,890 | $33,950 | $82,940 |
| 2014 | $5,180 | $142,630 | $53,600 | $89,030 |
Source: Public Records
Map
Nearby Homes
- 7 Ford Ln
- 155 Allen Rd
- 349 Allen Rd Unit 45D
- 85 Ford Ln
- 68 Westledge Terrace
- 129 Oakbrook Ln
- 305 Westledge Dr
- 0 Highland Ave Unit 24088105
- 95 Colorado Ave N
- 398 Funston Ave
- 169 Central Ave
- 146 Beechwood Ave
- 115 Beechwood Ave
- 80 Washington Ave
- 112 Greenfield Dr
- 83 Chelsea Ct
- 329 Church St
- 116 High St
- 147 Funston Ave
- 30 Culvert St
- 66 Birney Brook Rd
- 75 Birney Brook Rd
- 105 Adam Dr
- 56 Birney Brook Rd
- 71 Birney Brook Rd
- 157 Starview Dr
- 115 Adam Dr
- 169 Starview Dr
- 143 Starview Dr
- 67 Birney Brook Rd
- 63 Birney Brook Rd
- 49 Birney Brook Rd
- 46 Birney Brook Rd
- 129 Starview Dr
- 33 Birney Brook Rd
- 179 Starview Dr
- 38 Birney Brook Rd
- 34 Pondside Ln
- 65 Adam Dr
Your Personal Tour Guide
Ask me questions while you tour the home.