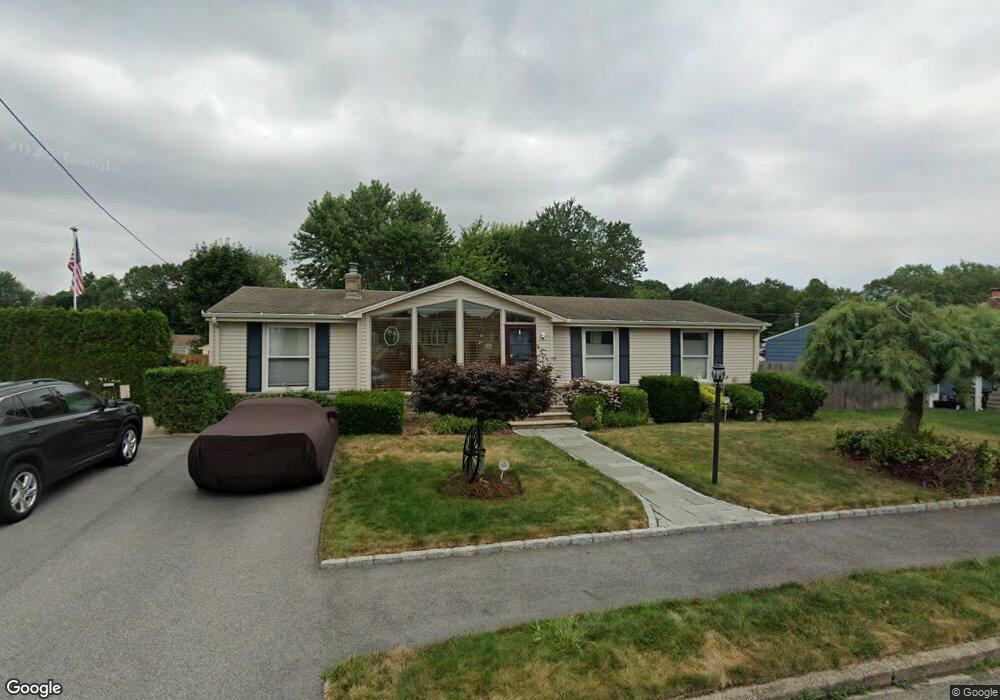
70 Burdick Dr Cranston, RI 02920
Oaklawn NeighborhoodEstimated Value: $460,384 - $506,000
3
Beds
2
Baths
1,880
Sq Ft
$261/Sq Ft
Est. Value
About This Home
This home is located at 70 Burdick Dr, Cranston, RI 02920 and is currently estimated at $491,346, approximately $261 per square foot. 70 Burdick Dr is a home located in Providence County with nearby schools including Glen Hills School, Western Hills Middle School, and Cranston High School West.
Ownership History
Date
Name
Owned For
Owner Type
Purchase Details
Closed on
Jun 12, 2024
Sold by
Iacabbo Frank and Iacabbo Solange
Bought by
Frank Iacabbo Jr Jrelt and Frank Iacabbo
Current Estimated Value
Purchase Details
Closed on
Sep 8, 2010
Sold by
Regine Matthew and Regine Annette
Bought by
Iacabbo Frank and Iacabbo Solange
Home Financials for this Owner
Home Financials are based on the most recent Mortgage that was taken out on this home.
Original Mortgage
$200,000
Interest Rate
4.55%
Mortgage Type
Purchase Money Mortgage
Create a Home Valuation Report for This Property
The Home Valuation Report is an in-depth analysis detailing your home's value as well as a comparison with similar homes in the area
Home Values in the Area
Average Home Value in this Area
Purchase History
| Date | Buyer | Sale Price | Title Company |
|---|---|---|---|
| Frank Iacabbo Jr Jrelt | -- | None Available | |
| Frank Iacabbo Jr Jrelt | -- | None Available | |
| Iacabbo Frank | $250,000 | -- | |
| Iacabbo Frank | $250,000 | -- |
Source: Public Records
Mortgage History
| Date | Status | Borrower | Loan Amount |
|---|---|---|---|
| Previous Owner | Iacabbo Frank | $121,000 | |
| Previous Owner | Iacabbo Frank | $200,000 | |
| Previous Owner | Iacabbo Frank | $150,000 |
Source: Public Records
Tax History
| Year | Tax Paid | Tax Assessment Tax Assessment Total Assessment is a certain percentage of the fair market value that is determined by local assessors to be the total taxable value of land and additions on the property. | Land | Improvement |
|---|---|---|---|---|
| 2025 | $5,465 | $393,700 | $108,700 | $285,000 |
| 2024 | $5,358 | $393,700 | $108,700 | $285,000 |
| 2023 | $5,109 | $270,300 | $75,000 | $195,300 |
| 2022 | $5,003 | $270,300 | $75,000 | $195,300 |
| 2021 | $4,865 | $270,300 | $75,000 | $195,300 |
| 2020 | $4,744 | $228,400 | $78,500 | $149,900 |
| 2019 | $4,744 | $228,400 | $78,500 | $149,900 |
| 2018 | $4,634 | $228,400 | $78,500 | $149,900 |
| 2017 | $4,418 | $192,600 | $71,400 | $121,200 |
| 2016 | $4,324 | $192,600 | $71,400 | $121,200 |
| 2015 | $4,324 | $192,600 | $71,400 | $121,200 |
| 2014 | $4,283 | $187,500 | $71,400 | $116,100 |
Source: Public Records
Map
Nearby Homes
- 50 Briarwood Rd
- 14 Amanda St
- 20 Hilltop Dr
- 1027 Providence St Unit 4B
- 78 Wilbur Ave
- 46 Hornbeam Dr
- 52 Cottonwood Dr
- 42 Woodland Dr
- 20 Manilla Ave
- 61 Crossland Rd
- 14 W Natick Rd
- 87 Lincoln Park Ave
- 6 Governors Hill Unit 6
- 0 Natick Rd
- 12 Railroad Row
- 10 East St Unit 316
- 82 Mountain Laurel Dr
- 63 Governors Hill Unit 63
- 36 Bleachery Ct
- 25 Wilson St
Your Personal Tour Guide
Ask me questions while you tour the home.