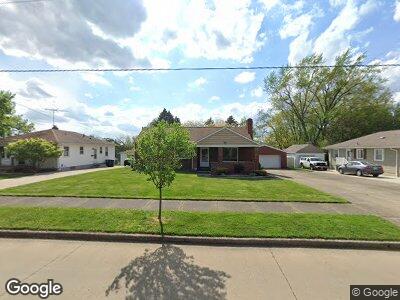
70 Eastholm Ave Akron, OH 44312
Ellet NeighborhoodEstimated Value: $150,535 - $183,000
3
Beds
1
Bath
1,174
Sq Ft
$142/Sq Ft
Est. Value
About This Home
This home is located at 70 Eastholm Ave, Akron, OH 44312 and is currently estimated at $166,884, approximately $142 per square foot. 70 Eastholm Ave is a home located in Summit County with nearby schools including Ellet High School, Summit Academy Akron Elementary School, and Akron Preparatory school.
Ownership History
Date
Name
Owned For
Owner Type
Purchase Details
Closed on
Dec 30, 2019
Sold by
Yeargin Rocco P and Estate Of Matthew Dauer
Bought by
Ellis Gary R
Current Estimated Value
Home Financials for this Owner
Home Financials are based on the most recent Mortgage that was taken out on this home.
Original Mortgage
$103,098
Outstanding Balance
$92,223
Interest Rate
3.7%
Mortgage Type
FHA
Estimated Equity
$65,881
Purchase Details
Closed on
Jul 31, 2014
Sold by
Hefling Ben and Hefling Pamela S
Bought by
Dauer Matthew F
Home Financials for this Owner
Home Financials are based on the most recent Mortgage that was taken out on this home.
Original Mortgage
$63,000
Interest Rate
4.19%
Mortgage Type
New Conventional
Purchase Details
Closed on
Sep 3, 2013
Sold by
U S Bank N A
Bought by
Hefling Ben and Hefling Pamela S
Purchase Details
Closed on
Aug 1, 2013
Sold by
Weiss Joseph P
Bought by
Us Bank Na
Create a Home Valuation Report for This Property
The Home Valuation Report is an in-depth analysis detailing your home's value as well as a comparison with similar homes in the area
Home Values in the Area
Average Home Value in this Area
Purchase History
| Date | Buyer | Sale Price | Title Company |
|---|---|---|---|
| Ellis Gary R | $105,000 | None Available | |
| Dauer Matthew F | $90,000 | Diamond Title Co | |
| Hefling Ben | $40,100 | None Available | |
| Us Bank Na | $66,000 | None Available |
Source: Public Records
Mortgage History
| Date | Status | Borrower | Loan Amount |
|---|---|---|---|
| Open | Ellis Gary R | $20,000 | |
| Open | Ellis Gary R | $103,098 | |
| Closed | Dauer Matthew F | $63,000 | |
| Previous Owner | Weiss Joseph P | $109,350 |
Source: Public Records
Tax History Compared to Growth
Tax History
| Year | Tax Paid | Tax Assessment Tax Assessment Total Assessment is a certain percentage of the fair market value that is determined by local assessors to be the total taxable value of land and additions on the property. | Land | Improvement |
|---|---|---|---|---|
| 2025 | $2,495 | $47,107 | $9,611 | $37,496 |
| 2024 | $2,495 | $47,107 | $9,611 | $37,496 |
| 2023 | $391 | $6,175 | $4,246 | $1,929 |
| 2022 | $2,407 | $35,690 | $7,284 | $28,406 |
| 2021 | $2,410 | $35,690 | $7,284 | $28,406 |
| 2020 | $406 | $35,690 | $7,280 | $28,410 |
| 2019 | $394 | $29,550 | $6,990 | $22,560 |
| 2018 | $390 | $29,550 | $6,990 | $22,560 |
| 2017 | $1,851 | $29,550 | $6,990 | $22,560 |
| 2016 | $395 | $24,960 | $6,990 | $17,970 |
| 2015 | $1,851 | $24,960 | $6,990 | $17,970 |
| 2014 | $1,886 | $24,960 | $6,990 | $17,970 |
| 2013 | $1,953 | $27,210 | $6,990 | $20,220 |
Source: Public Records
Map
Nearby Homes
- 172 Emmons Ave
- 104 Robinwood Blvd
- 76 Pfeiffer Ave
- 98 Hawk Ave
- 111 Akers Ave
- 2202 Cramer Ave
- 163 the Brooklands
- 461 Boyd Ave
- 360 Homewood Ave
- 477 Lamont St
- 43 Ansel Ave
- 1897 Marks Ave
- 298 Hilbish Ave
- 1849 Ford Ave
- 347 Booth Ave
- 0 Adelaide Blvd
- 151 Ansel Ave
- 161 Ansel Ave
- 2551 Robindale Ave
- 1809 Marks Ave
- 70 Eastholm Ave
- 70 Eastholm Ave
- 64 Eastholm Ave
- 76 Eastholm Ave
- 60 Eastholm Ave
- 56 Eastholm Ave
- 2201 Windemere Ave
- 2201 Windemere Ave
- 86 Eastholm Ave
- 53 Berwyck Dr
- 45 Berwyck Dr
- 57 Berwyck Dr
- 50 Eastholm Ave
- 39 Berwyck Dr
- 75 Eastholm Ave
- 63 Eastholm Ave
- 63 Berwyck Dr
- 35 Berwyck Dr
- 46 Eastholm Ave
- 85 Eastholm Ave