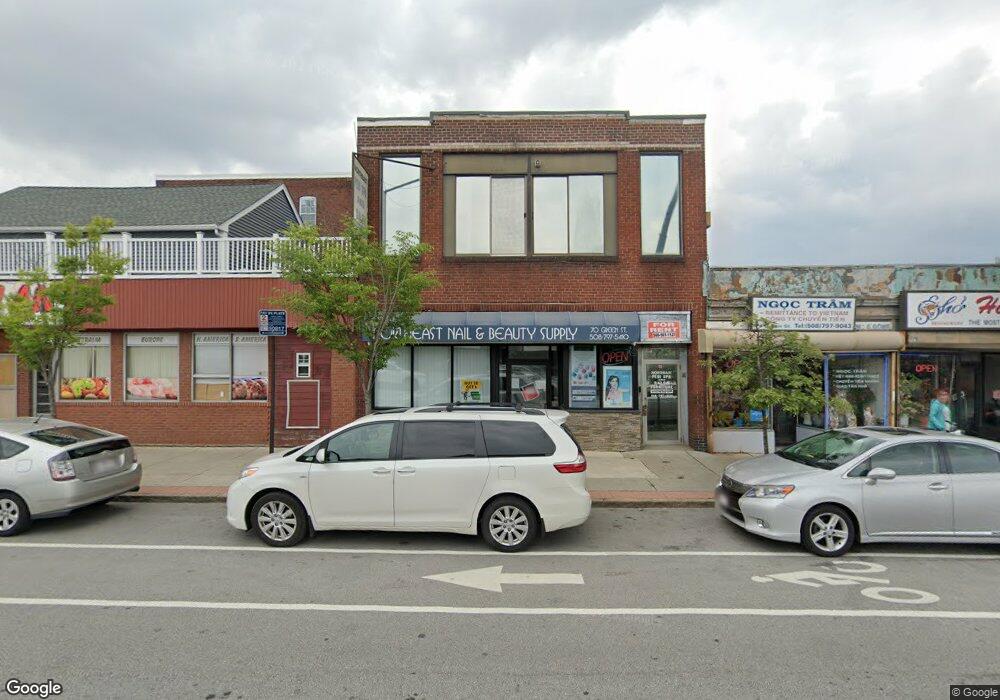
70 Green St Unit 2 Worcester, MA 01604
Green Island NeighborhoodEstimated Value: $483,594
--
Bed
1
Bath
1,300
Sq Ft
$372/Sq Ft
Est. Value
About This Home
This home is located at 70 Green St Unit 2, Worcester, MA 01604 and is currently estimated at $483,594, approximately $371 per square foot. 70 Green St Unit 2 is a home located in Worcester County with nearby schools including Chandler Elementary Community School, Jacob Hiatt Magnet School, and Chandler Magnet.
Ownership History
Date
Name
Owned For
Owner Type
Purchase Details
Closed on
Oct 2, 2009
Sold by
Oles Stephen B
Bought by
Ax Invest Llc
Current Estimated Value
Home Financials for this Owner
Home Financials are based on the most recent Mortgage that was taken out on this home.
Original Mortgage
$110,000
Outstanding Balance
$71,975
Interest Rate
5.12%
Mortgage Type
Commercial
Estimated Equity
$411,619
Create a Home Valuation Report for This Property
The Home Valuation Report is an in-depth analysis detailing your home's value as well as a comparison with similar homes in the area
Home Values in the Area
Average Home Value in this Area
Purchase History
| Date | Buyer | Sale Price | Title Company |
|---|---|---|---|
| Ax Invest Llc | $210,000 | -- |
Source: Public Records
Mortgage History
| Date | Status | Borrower | Loan Amount |
|---|---|---|---|
| Open | Ax Invest Llc | $110,000 |
Source: Public Records
Tax History Compared to Growth
Tax History
| Year | Tax Paid | Tax Assessment Tax Assessment Total Assessment is a certain percentage of the fair market value that is determined by local assessors to be the total taxable value of land and additions on the property. | Land | Improvement |
|---|---|---|---|---|
| 2025 | $8,800 | $307,600 | $67,600 | $240,000 |
| 2024 | $7,922 | $263,700 | $67,600 | $196,100 |
| 2023 | $6,793 | $217,300 | $58,700 | $158,600 |
| 2022 | $6,783 | $203,500 | $58,700 | $144,800 |
| 2021 | $7,986 | $220,600 | $44,800 | $175,800 |
| 2020 | $7,753 | $220,500 | $44,800 | $175,700 |
| 2019 | $7,612 | $218,100 | $43,600 | $174,500 |
| 2018 | $8,051 | $236,600 | $43,600 | $193,000 |
| 2017 | $7,791 | $236,600 | $43,600 | $193,000 |
| 2016 | $7,608 | $223,900 | $38,500 | $185,400 |
| 2015 | $7,104 | $223,900 | $38,500 | $185,400 |
| 2014 | $6,903 | $223,900 | $38,500 | $185,400 |
Source: Public Records
Map
Nearby Homes
- 70 Southbridge St Unit 310
- 70 Southbridge St Unit 611
- 22 Waverly St
- 531 Main St Unit 503
- 531 Main St Unit 410
- 531 Main St Unit 403
- 1 Arlington St
- 71 Fox St
- 10 Ellsworth St
- 82 Fox St
- 7 Lodi St
- 37 Vernon St
- 340 Harding St
- 49 Richland St
- 91 Fox St
- 17 Mott St
- 13 Sigel St
- 195 Millbury St
- 33 Sigel St Unit B
- 44 Elm St Unit 501