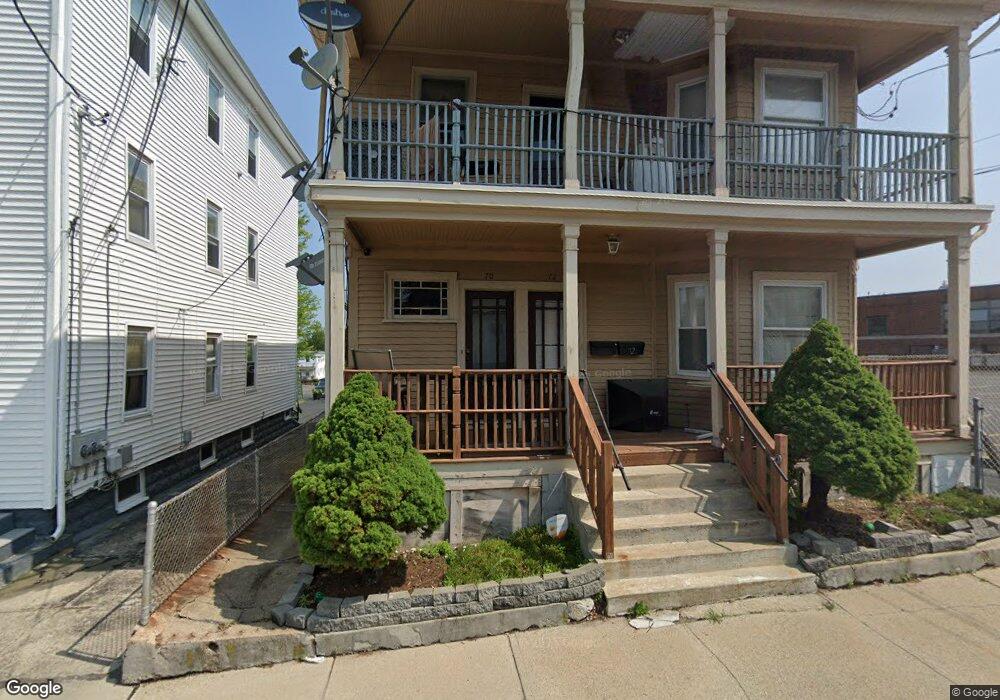
70 Hillhurst Ave Unit 72 Providence, RI 02909
Silver Lake NeighborhoodEstimated Value: $451,914 - $648,000
6
Beds
3
Baths
2,388
Sq Ft
$232/Sq Ft
Est. Value
About This Home
This home is located at 70 Hillhurst Ave Unit 72, Providence, RI 02909 and is currently estimated at $554,979, approximately $232 per square foot. 70 Hillhurst Ave Unit 72 is a home located in Providence County with nearby schools including Charles N. Fortes Elementary School, Asa Messer Elementary School, and Laurel Hill Annex School.
Ownership History
Date
Name
Owned For
Owner Type
Purchase Details
Closed on
May 2, 2018
Sold by
Nero Patricia and Nero Jaimice N
Bought by
Perez Carlos
Current Estimated Value
Purchase Details
Closed on
Jul 3, 2017
Sold by
Narrows Realty Llc and Providence City Of
Bought by
Perez Carlos
Purchase Details
Closed on
Sep 8, 2015
Sold by
Longship Investments L and Providence Town Of
Bought by
Perez Carlos
Purchase Details
Closed on
Oct 2, 2009
Sold by
Goldberger Dennis and Pipippo Pasquale
Bought by
Perez Carlos
Home Financials for this Owner
Home Financials are based on the most recent Mortgage that was taken out on this home.
Original Mortgage
$159,065
Interest Rate
5.12%
Mortgage Type
Purchase Money Mortgage
Purchase Details
Closed on
May 7, 2009
Sold by
Us Bank Na
Bought by
Goldberger Dennis and Dipippo Pasquale
Purchase Details
Closed on
Nov 12, 2008
Sold by
Fernandez Maria
Bought by
Us Bank Na
Purchase Details
Closed on
Nov 30, 2004
Sold by
Perez Elba Rosa
Bought by
Fernandez Maria
Purchase Details
Closed on
Jul 18, 1994
Sold by
Nero Pat
Bought by
Perez Neftali and Perez Elba
Create a Home Valuation Report for This Property
The Home Valuation Report is an in-depth analysis detailing your home's value as well as a comparison with similar homes in the area
Home Values in the Area
Average Home Value in this Area
Purchase History
| Date | Buyer | Sale Price | Title Company |
|---|---|---|---|
| Perez Carlos | -- | -- | |
| Perez Carlos | -- | -- | |
| Perez Carlos | -- | -- | |
| Perez Carlos | $162,000 | -- | |
| Goldberger Dennis | $80,000 | -- | |
| Us Bank Na | $165,000 | -- | |
| Fernandez Maria | $287,500 | -- | |
| Perez Neftali | $51,000 | -- |
Source: Public Records
Mortgage History
| Date | Status | Borrower | Loan Amount |
|---|---|---|---|
| Previous Owner | Perez Neftali | $8,564 | |
| Previous Owner | Perez Neftali | $159,065 |
Source: Public Records
Tax History Compared to Growth
Tax History
| Year | Tax Paid | Tax Assessment Tax Assessment Total Assessment is a certain percentage of the fair market value that is determined by local assessors to be the total taxable value of land and additions on the property. | Land | Improvement |
|---|---|---|---|---|
| 2025 | $3,302 | $437,400 | $132,900 | $304,500 |
| 2024 | $5,485 | $298,900 | $84,100 | $214,800 |
| 2023 | $5,485 | $298,900 | $84,100 | $214,800 |
| 2022 | $5,320 | $298,900 | $84,100 | $214,800 |
| 2021 | $2,557 | $173,500 | $47,600 | $125,900 |
| 2020 | $2,557 | $173,500 | $47,600 | $125,900 |
| 2019 | $4,261 | $173,500 | $47,600 | $125,900 |
| 2018 | $3,950 | $123,600 | $40,600 | $83,000 |
| 2017 | $3,950 | $123,600 | $40,600 | $83,000 |
| 2016 | $4,027 | $126,000 | $43,000 | $83,000 |
| 2015 | $3,621 | $109,400 | $43,000 | $66,400 |
| 2014 | $3,692 | $109,400 | $43,000 | $66,400 |
| 2013 | $3,692 | $109,400 | $43,000 | $66,400 |
Source: Public Records
Map
Nearby Homes
- 355 Laurel Hill Ave
- 20 Magdalene St
- 41 Terrace Ave
- 454 Union Ave
- 14 Shafter St
- 27 What Cheer Ave
- 26 Alto St
- 27 Moorefield St
- 144 Daniel Ave
- 36 Moorefield St Unit 38
- 372 Farmington Ave
- 121 Hillwood St
- 161 Prudence Ave
- 342 Union Ave
- 32 Maplewood Ave
- 293 Webster Ave
- 649 Union Ave
- 87 Dunedin St
- 121 Heather St
- 79 Priscilla Ave
- 60 Hillhurst Ave
- 54 Hillhurst Ave
- 67 Hillhurst Ave
- 77 Hillhurst Ave
- 59 Hillhurst Ave
- 46 Hillhurst Ave
- 305 Laurel Hill Ave
- 53 Hillhurst Ave
- 80 What Cheer Ave
- 82 What Cheer Ave
- 50 Hauxhurst St
- 44 Hillhurst Ave
- 66 What Cheer Ave
- 86 What Cheer Ave
- 49 Hillhurst Ave
- 60 What Cheer Ave
- 1113 Hill Hurst Ave
- 42 Hillhurst Ave
- 90 What Cheer Ave
- 56 What Cheer Ave