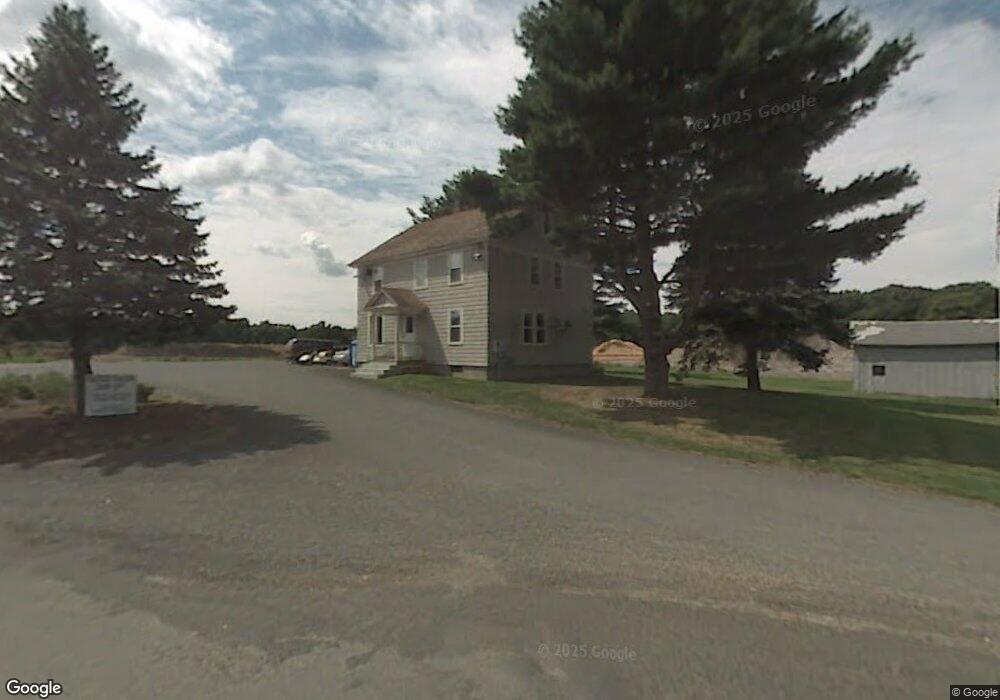
70 Mullen Rd Enfield, CT 06082
Estimated Value: $271,842
3
Beds
1
Bath
1,664
Sq Ft
$163/Sq Ft
Est. Value
About This Home
This home is located at 70 Mullen Rd, Enfield, CT 06082 and is currently estimated at $271,842, approximately $163 per square foot. 70 Mullen Rd is a home located in Hartford County with nearby schools including Edgar H. Parkman School, Enfield Street Elementary School, and John F. Kennedy Middle School.
Ownership History
Date
Name
Owned For
Owner Type
Purchase Details
Closed on
Sep 29, 2025
Sold by
70 Mullen Llc
Bought by
70 Mullen Llc
Current Estimated Value
Purchase Details
Closed on
Jun 25, 2024
Sold by
Lindeland Brenda G and Lindeland Kenneth A
Bought by
70 Mullen Llc
Purchase Details
Closed on
Jun 27, 2019
Sold by
Rhresher Ralph E Est and Champagne
Bought by
39 Mullen Road Llc
Purchase Details
Closed on
Jun 21, 2012
Sold by
Fortune Annette and Donovan Deborah
Bought by
Lindeland Kenneth A and Lindeland Brenda G
Purchase Details
Closed on
Aug 22, 2001
Sold by
Tyler Marilyn
Bought by
Lindeland Kenneth and Lindeland Brenda
Create a Home Valuation Report for This Property
The Home Valuation Report is an in-depth analysis detailing your home's value as well as a comparison with similar homes in the area
Home Values in the Area
Average Home Value in this Area
Purchase History
| Date | Buyer | Sale Price | Title Company |
|---|---|---|---|
| 70 Mullen Llc | -- | -- | |
| 70 Mullen Llc | -- | None Available | |
| 70 Mullen Llc | -- | None Available | |
| 39 Mullen Road Llc | $150,000 | -- | |
| 39 Mullen Road Llc | $150,000 | -- | |
| Lindeland Kenneth A | $36,890 | -- | |
| Lindeland Kenneth A | $36,890 | -- | |
| Lindeland Kenneth | $900,000 | -- | |
| Lindeland Kenneth | $900,000 | -- |
Source: Public Records
Mortgage History
| Date | Status | Borrower | Loan Amount |
|---|---|---|---|
| Previous Owner | Lindeland Kenneth | $5,886,694 | |
| Previous Owner | Lindeland Kenneth | $600,000 |
Source: Public Records
Tax History Compared to Growth
Tax History
| Year | Tax Paid | Tax Assessment Tax Assessment Total Assessment is a certain percentage of the fair market value that is determined by local assessors to be the total taxable value of land and additions on the property. | Land | Improvement |
|---|---|---|---|---|
| 2025 | $9,685 | $276,800 | $150,700 | $126,100 |
| 2024 | $9,425 | $276,800 | $150,700 | $126,100 |
| 2023 | $25,927 | $767,080 | $503,780 | $263,300 |
| 2022 | $23,542 | $767,080 | $503,780 | $263,300 |
| 2021 | $7,288 | $194,190 | $112,650 | $81,540 |
| 2020 | $7,288 | $194,190 | $112,650 | $81,540 |
| 2019 | $7,307 | $194,190 | $112,650 | $81,540 |
| 2018 | $7,185 | $194,190 | $112,650 | $81,540 |
| 2017 | $6,783 | $194,190 | $112,650 | $81,540 |
| 2016 | $6,330 | $184,490 | $110,810 | $73,680 |
| 2015 | $6,132 | $184,490 | $110,810 | $73,680 |
| 2014 | $5,974 | $184,490 | $110,810 | $73,680 |
Source: Public Records
Map
Nearby Homes
- 76 Mullen Rd
- 69 Mullen Rd
- 80 Mullen Rd
- 82 Mullen Rd
- 65 Mullen Rd
- 61 Mullen Rd
- 57 Mullen Rd
- 90 Mullen Rd
- 85 Mullen Rd
- 46 Mullen Rd
- 94 Mullen Rd
- 131 North Rd
- 17 Mullen Rd
- 51 Carriage House
- 11 Carriage House
- 11 Carriage House Unit 11..
- 47 Mullen Rd
- 3 Mullen Rd
- 44 Carriage House
- 44 Carriage House Unit 44