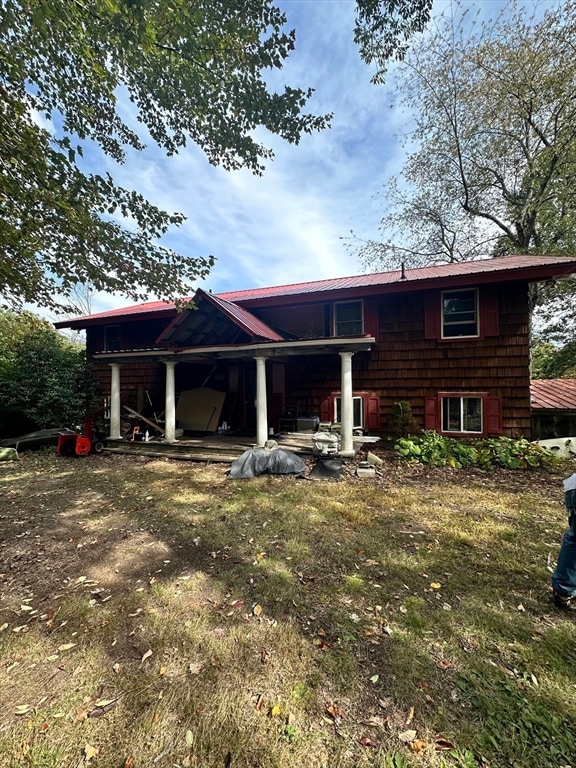
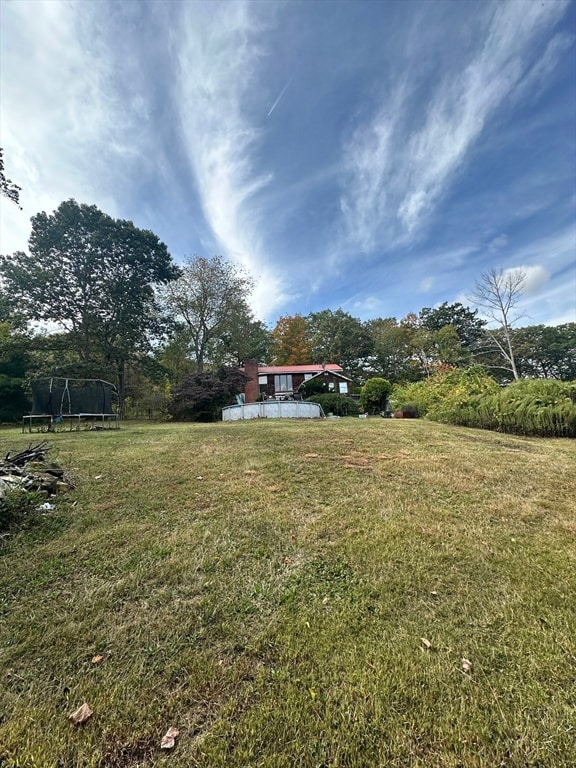
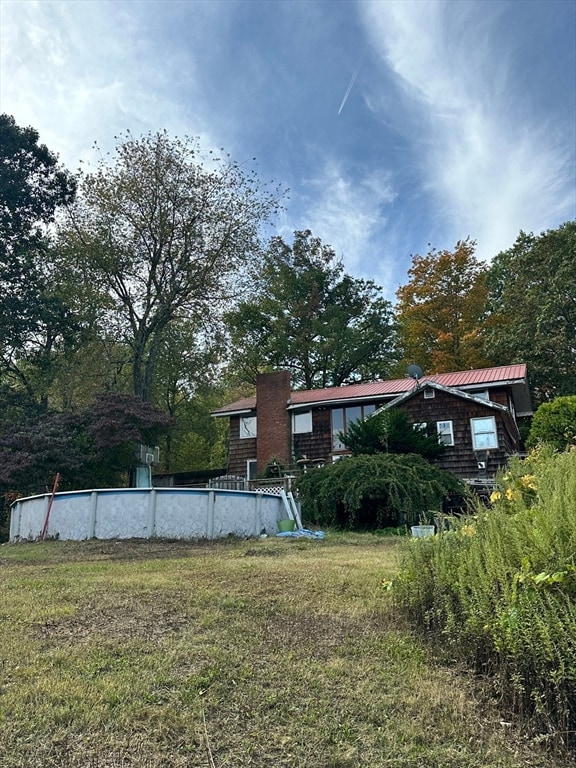
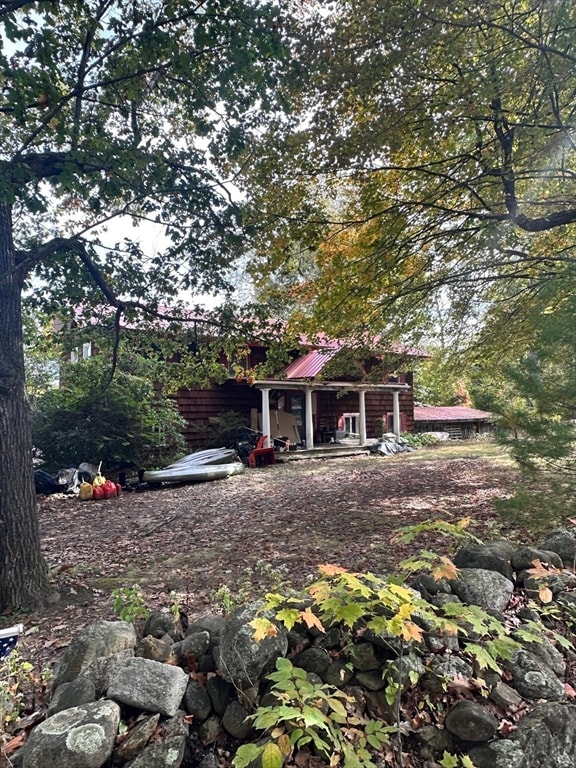
70 N Main St New Salem, MA 01355
New Salem NeighborhoodEstimated payment $1,943/month
Highlights
- Colonial Architecture
- 2 Fireplaces
- Window Unit Cooling System
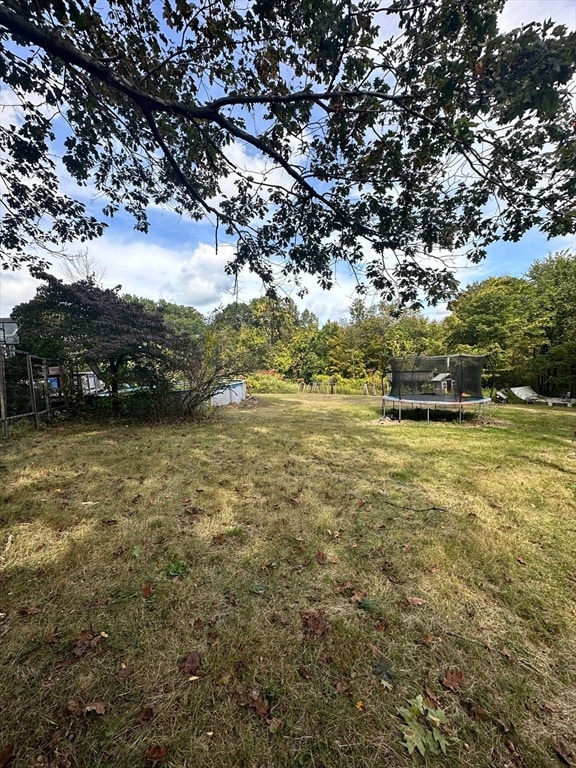
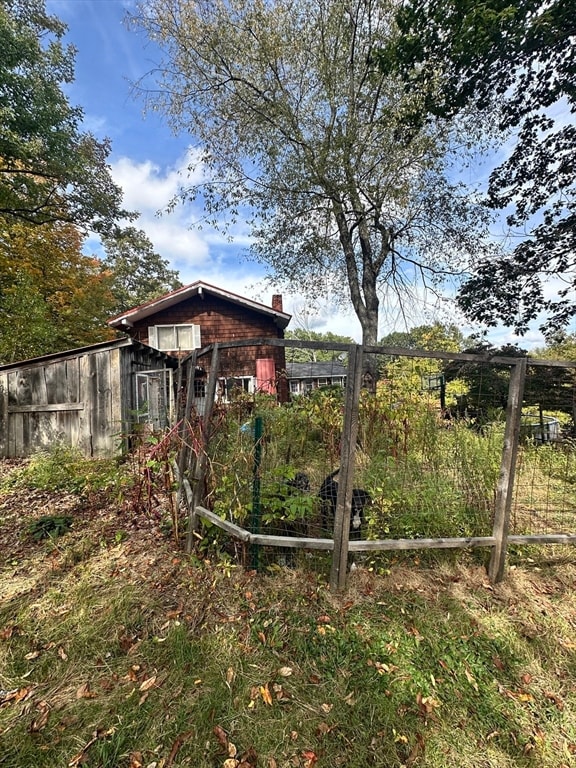
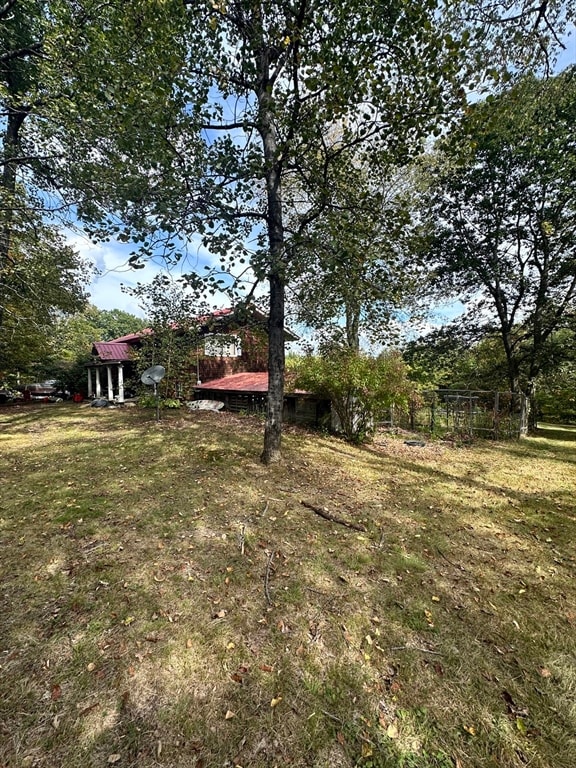
- Wooded Lot
- No HOA
- Baseboard Heating
About This Home
Incredible Opportunity! This is your time to build some instant equity! Recently appraised "as is" at $410,000, this property offers a chance to purchase below market value! The septic system was newly installed in 2007 when the current owner purchased the home. Title V inspection will be the buyer’s responsibility, but the seller is confident it will pass—making it eligible for buyers using financing. Don’t miss out on this great value!

Home Details
Home Type
- Single Family
Est. Annual Taxes
- $4,400
Year Built
- Built in 1967
Lot Details
- 1.2 Acre Lot
- Wooded Lot
Parking
- 4 Car Parking Spaces
Home Design
- Colonial Architecture
- Wood Roof
- Concrete Perimeter Foundation
Interior Spaces
- 2,304 Sq Ft Home
- 2 Fireplaces
- Partially Finished Basement
Bedrooms and Bathrooms
- 3 Bedrooms
- 2 Full Bathrooms
Utilities
- Window Unit Cooling System
- Baseboard Heating
- Private Water Source
- Private Sewer
Community Details
- No Home Owners Association
Listing and Financial Details
- Assessor Parcel Number 3112298
Map
Home Values in the Area
Average Home Value in this Area
Tax History
| Year | Tax Paid | Tax Assessment Tax Assessment Total Assessment is a certain percentage of the fair market value that is determined by local assessors to be the total taxable value of land and additions on the property. | Land | Improvement |
|---|---|---|---|---|
| 2025 | $4,400 | $324,000 | $44,800 | $279,200 |
| 2024 | $4,144 | $288,400 | $44,800 | $243,600 |
| 2023 | $4,857 | $316,400 | $50,500 | $265,900 |
| 2022 | $4,227 | $223,400 | $50,500 | $172,900 |
| 2021 | $4,001 | $203,800 | $46,000 | $157,800 |
| 2020 | $4,887 | $203,800 | $46,000 | $157,800 |
| 2019 | $4,858 | $203,800 | $46,000 | $157,800 |
| 2018 | $4,819 | $202,500 | $44,500 | $158,000 |
| 2017 | $4,624 | $193,300 | $42,500 | $150,800 |
| 2016 | $3,331 | $193,300 | $42,500 | $150,800 |
| 2015 | $3,398 | $206,200 | $44,200 | $162,000 |
Property History
| Date | Event | Price | List to Sale | Price per Sq Ft |
|---|---|---|---|---|
| 10/29/2025 10/29/25 | Pending | -- | -- | -- |
| 10/22/2025 10/22/25 | Price Changed | $299,000 | +11.2% | $130 / Sq Ft |
| 10/15/2025 10/15/25 | For Sale | $269,000 | -- | $117 / Sq Ft |
Purchase History
| Date | Type | Sale Price | Title Company |
|---|---|---|---|
| Deed | $241,000 | -- | |
| Deed | $140,000 | -- |
Mortgage History
| Date | Status | Loan Amount | Loan Type |
|---|---|---|---|
| Open | $192,800 | Purchase Money Mortgage | |
| Previous Owner | $243,000 | No Value Available | |
| Previous Owner | $40,000 | No Value Available | |
| Previous Owner | $126,000 | Purchase Money Mortgage | |
| Previous Owner | $131,400 | No Value Available |
Source: MLS Property Information Network (MLS PIN)
MLS Number: 73443975
APN: NEWS-000409-000000-000018
Disclaimer: Certain information contained herein is derived from information provided by parties other than Homes.com. All information provided is deemed reliable, but is not guaranteed to be accurate and should be independently verified.
![]() The property listing data and information, or the Images, set forth herein were provided to MLS Property Information Network, Inc. from third party sources, including sellers, lessors and public records, and were compiled by MLS Property Information Network, Inc. The property listing data and information, and the Images, are for the personal, non-commercial use of consumers having a good faith interest in purchasing or leasing listed properties of the type displayed to them and may not be used for any purpose other than to identify prospective properties which such consumers may have a good faith interest in purchasing or leasing. MLS Property Information Network, Inc. and its subscribers disclaim any and all representations and warranties as to the accuracy of the property listing data and information, or as to the accuracy of any of the Images, set forth herein.
The property listing data and information, or the Images, set forth herein were provided to MLS Property Information Network, Inc. from third party sources, including sellers, lessors and public records, and were compiled by MLS Property Information Network, Inc. The property listing data and information, and the Images, are for the personal, non-commercial use of consumers having a good faith interest in purchasing or leasing listed properties of the type displayed to them and may not be used for any purpose other than to identify prospective properties which such consumers may have a good faith interest in purchasing or leasing. MLS Property Information Network, Inc. and its subscribers disclaim any and all representations and warranties as to the accuracy of the property listing data and information, or as to the accuracy of any of the Images, set forth herein.
- 72 N Main St
- 0 Wendell Rd
- Lot 55 Wendell Rd
- 2 Fay Rd
- 0 S Main St
- 38 Camp Rd
- 270 Holtshire Rd
- 610 S Main St
- 28 Morse Village Rd
- Back Lot 0 Petersham Rd
- 0 Cooleyville Rd
- 100 Lake Mattawa Rd
- 240 Holtshire Rd Unit Lot 2
- 0 Lake Mattawa Rd
- 00 S Main St
- 000 S Main St
- 53 Daniel Shays Hwy
- 490 S Main St
- 276 Pleasant St
- 4 West St