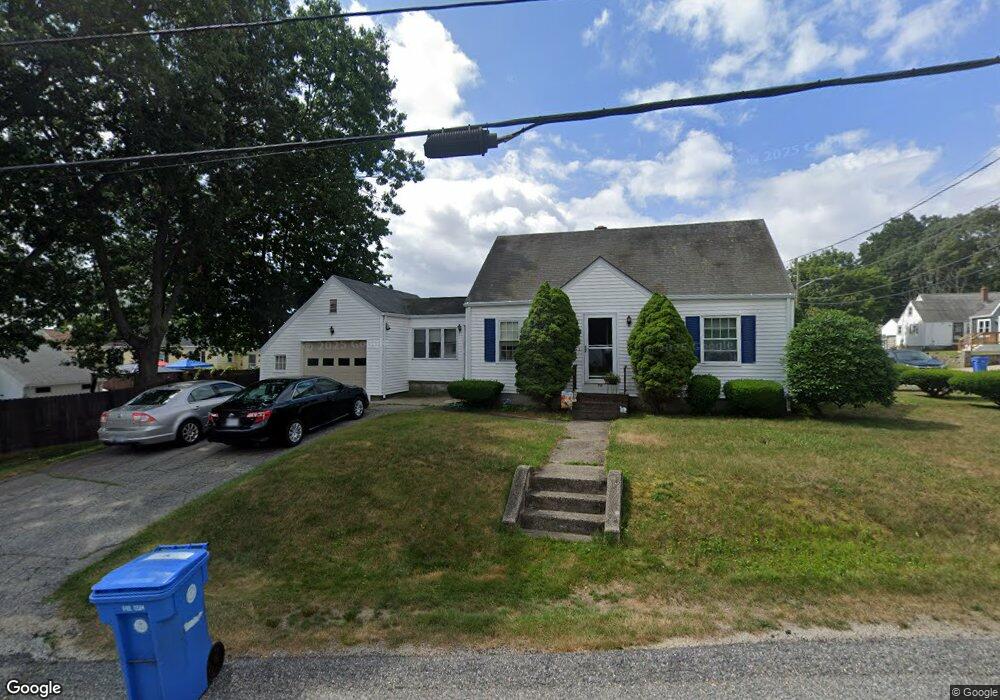
70 Old Willis Rd Cumberland, RI 02864
Valley Falls NeighborhoodEstimated Value: $403,287 - $440,000
4
Beds
1
Bath
2,380
Sq Ft
$176/Sq Ft
Est. Value
About This Home
This home is located at 70 Old Willis Rd, Cumberland, RI 02864 and is currently estimated at $419,822, approximately $176 per square foot. 70 Old Willis Rd is a home located in Providence County with nearby schools including B.F. Norton Elementary School, Joseph L. McCourt Middle School, and Cumberland High School.
Ownership History
Date
Name
Owned For
Owner Type
Purchase Details
Closed on
Sep 28, 2007
Sold by
Deutsche Bank Natl T C
Bought by
Emery Brian M and Emery Pamela J
Current Estimated Value
Home Financials for this Owner
Home Financials are based on the most recent Mortgage that was taken out on this home.
Original Mortgage
$214,515
Interest Rate
6.65%
Mortgage Type
VA
Purchase Details
Closed on
May 3, 2007
Sold by
Eliasz James E and Deutsche Bank Natl T C
Bought by
Deutsche Bank Natl T C
Create a Home Valuation Report for This Property
The Home Valuation Report is an in-depth analysis detailing your home's value as well as a comparison with similar homes in the area
Home Values in the Area
Average Home Value in this Area
Purchase History
| Date | Buyer | Sale Price | Title Company |
|---|---|---|---|
| Emery Brian M | $210,000 | -- | |
| Deutsche Bank Natl T C | $231,100 | -- |
Source: Public Records
Mortgage History
| Date | Status | Borrower | Loan Amount |
|---|---|---|---|
| Open | Deutsche Bank Natl T C | $216,000 | |
| Closed | Deutsche Bank Natl T C | $214,515 | |
| Previous Owner | Deutsche Bank Natl T C | $220,500 |
Source: Public Records
Tax History Compared to Growth
Tax History
| Year | Tax Paid | Tax Assessment Tax Assessment Total Assessment is a certain percentage of the fair market value that is determined by local assessors to be the total taxable value of land and additions on the property. | Land | Improvement |
|---|---|---|---|---|
| 2025 | $3,503 | $285,500 | $131,400 | $154,100 |
| 2024 | $3,412 | $285,500 | $131,400 | $154,100 |
| 2023 | $3,318 | $285,500 | $131,400 | $154,100 |
| 2022 | $3,136 | $209,200 | $91,900 | $117,300 |
| 2021 | $3,084 | $209,200 | $91,900 | $117,300 |
| 2020 | $2,996 | $209,200 | $91,900 | $117,300 |
| 2019 | $2,892 | $182,100 | $76,700 | $105,400 |
| 2018 | $2,808 | $182,100 | $76,700 | $105,400 |
| 2017 | $2,770 | $182,100 | $76,700 | $105,400 |
| 2016 | $2,374 | $139,000 | $68,500 | $70,500 |
| 2015 | $2,374 | $139,000 | $68,500 | $70,500 |
| 2014 | $4,872 | $139,000 | $68,500 | $70,500 |
| 2013 | $2,490 | $157,800 | $72,400 | $85,400 |
Source: Public Records
Map
Nearby Homes