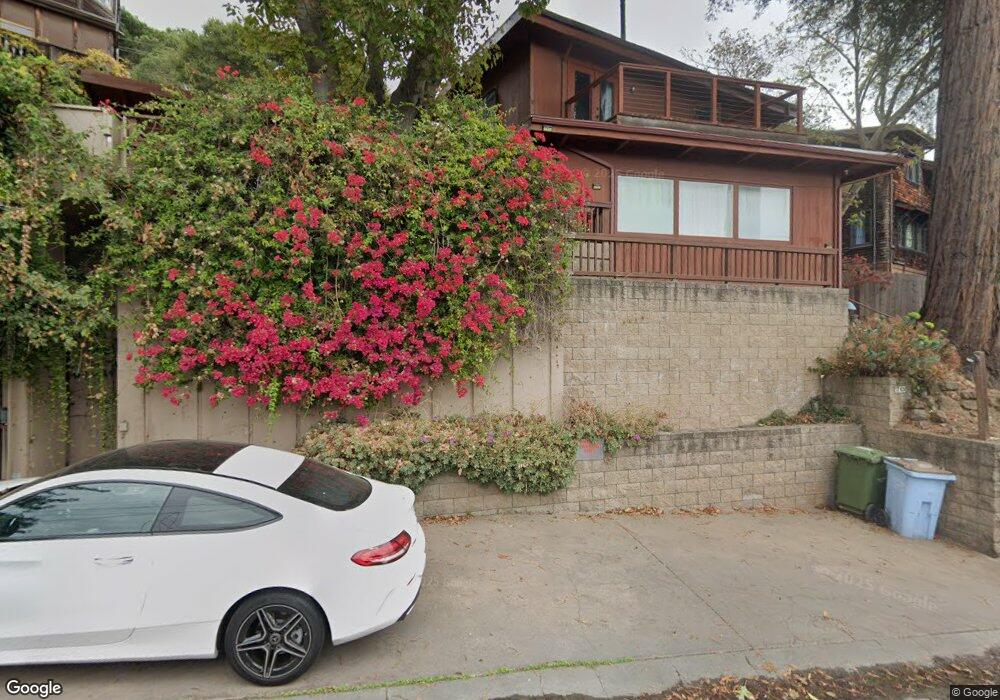
70 Panoramic Way Berkeley, CA 94704
Estimated Value: $1,454,000 - $1,999,000
4
Beds
2
Baths
1,990
Sq Ft
$860/Sq Ft
Est. Value
About This Home
This home is located at 70 Panoramic Way, Berkeley, CA 94704 and is currently estimated at $1,711,825, approximately $860 per square foot. 70 Panoramic Way is a home located in Alameda County with nearby schools including Emerson Elementary School, John Muir Elementary School, and Malcolm X Elementary School.
Ownership History
Date
Name
Owned For
Owner Type
Purchase Details
Closed on
May 4, 2018
Sold by
Zhang Mingjian and Zhang Yuanfang
Bought by
Green Zoom Star Llc
Current Estimated Value
Purchase Details
Closed on
Sep 6, 2016
Sold by
Yin Huanhuan
Bought by
Zhang Mingjian
Home Financials for this Owner
Home Financials are based on the most recent Mortgage that was taken out on this home.
Original Mortgage
$945,000
Interest Rate
3.48%
Mortgage Type
New Conventional
Purchase Details
Closed on
Aug 24, 2016
Sold by
Royce Kim and The Do Freeman 1998 Trust
Bought by
Zhang Mingjian and Zhang Yuanfang
Home Financials for this Owner
Home Financials are based on the most recent Mortgage that was taken out on this home.
Original Mortgage
$945,000
Interest Rate
3.48%
Mortgage Type
New Conventional
Purchase Details
Closed on
Oct 12, 1998
Sold by
Freeman Doreliesje and Freeman Walter J
Bought by
Freeman Walter J and Freeman Do
Create a Home Valuation Report for This Property
The Home Valuation Report is an in-depth analysis detailing your home's value as well as a comparison with similar homes in the area
Purchase History
| Date | Buyer | Sale Price | Title Company |
|---|---|---|---|
| Green Zoom Star Llc | -- | None Available | |
| Zhang Mingjian | -- | Old Republic Title Company | |
| Zhang Mingjian | $1,350,000 | Old Republic Title Company | |
| Freeman Walter J | -- | -- |
Source: Public Records
Mortgage History
| Date | Status | Borrower | Loan Amount |
|---|---|---|---|
| Previous Owner | Zhang Mingjian | $945,000 |
Source: Public Records
Tax History
| Year | Tax Paid | Tax Assessment Tax Assessment Total Assessment is a certain percentage of the fair market value that is determined by local assessors to be the total taxable value of land and additions on the property. | Land | Improvement |
|---|---|---|---|---|
| 2025 | $23,303 | $1,566,755 | $470,026 | $1,096,729 |
| 2024 | $23,303 | $1,536,043 | $460,813 | $1,075,230 |
| 2023 | $22,794 | $1,505,924 | $451,777 | $1,054,147 |
| 2022 | $22,892 | $1,476,400 | $442,920 | $1,033,480 |
| 2021 | $22,976 | $1,447,455 | $434,236 | $1,013,219 |
| 2020 | $21,946 | $1,432,620 | $429,786 | $1,002,834 |
| 2019 | $21,303 | $1,404,540 | $421,362 | $983,178 |
| 2018 | $19,866 | $1,377,000 | $413,100 | $963,900 |
| 2017 | $19,203 | $1,350,000 | $405,000 | $945,000 |
| 2016 | $4,613 | $176,156 | $100,609 | $75,547 |
| 2015 | $4,524 | $173,511 | $99,098 | $74,413 |
| 2014 | $4,387 | $170,112 | $97,157 | $72,955 |
Source: Public Records
Map
Nearby Homes
- 2 Panoramic Way Unit 105
- 2 Panoramic Way Unit 304
- 0 Panoramic Way Unit 41118724
- 39 Canyon Rd
- 161 Panoramic Way
- 3382 Dwight Way
- 2611 Piedmont Ave Unit 4
- 2632 Warring St Unit 3
- 2601 College Ave Unit 203
- 2601 College Ave Unit 208
- 2509 Dwight Way
- 2817 Palm Ct
- 190 Stonewall Rd
- 2643 Stuart St
- 2535 Chilton Way
- 2700 Le Conte Ave Unit 301
- 2700 Le Conte Ave Unit 402
- 2550 Dana St Unit 2F
- 2634 Virginia St Unit 13
- 2702 Dana St
- 94 Panoramic Way
- 66 Panoramic Way
- 120 Panoramic Way
- 27 Panoramic Way
- 67 Panoramic Way
- 65 Panoramic Way Unit A
- 64 Panoramic Way Unit C
- 64 Panoramic Way Unit B
- 64 Panoramic Way
- 74 Panoramic Way
- 61 Panoramic Way
- 59 Panoramic Way
- 59 Panoramic Way
- 57 Panoramic Way
- 57 Panoramic Way
- 25 Panoramic Way
- 55 Panoramic Way
- 73 Panoramic Way
- 121 Panoramic Way
- 62 Panoramic Way
Your Personal Tour Guide
Ask me questions while you tour the home.