Estimated Value: $578,000 - $833,000
3
Beds
1
Bath
1,144
Sq Ft
$647/Sq Ft
Est. Value
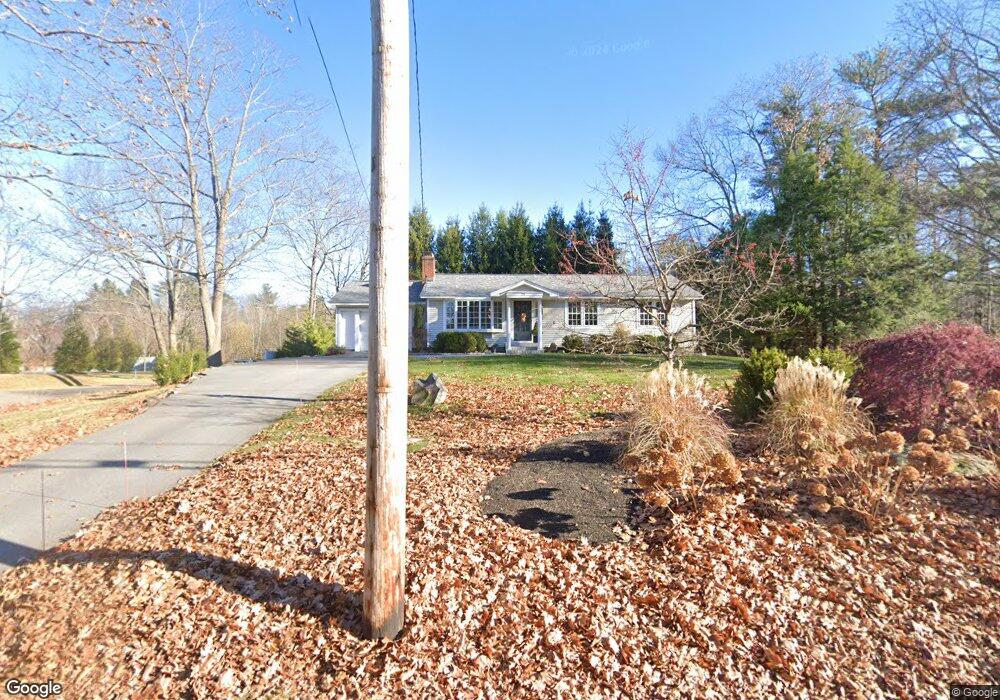
About This Home
This home is located at 70 Sagamore Rd, Rye, NH 03870 and is currently estimated at $740,270, approximately $647 per square foot. 70 Sagamore Rd is a home located in Rockingham County with nearby schools including Rye Elementary School, Rye Junior High School, and St Patrick School.
Ownership History
Date
Name
Owned For
Owner Type
Purchase Details
Closed on
Mar 8, 2025
Sold by
Moores Kelly
Bought by
Kelly Moores Ret 2024 and Moores
Current Estimated Value
Purchase Details
Closed on
Nov 12, 2009
Sold by
Deutsche Bk Natl T Co
Bought by
Moores Kelly A
Home Financials for this Owner
Home Financials are based on the most recent Mortgage that was taken out on this home.
Original Mortgage
$230,000
Interest Rate
4.98%
Mortgage Type
Purchase Money Mortgage
Purchase Details
Closed on
Mar 5, 2009
Sold by
Cavaretta Tammy A and Deutsche Bk Natl T Co
Bought by
Deutsche Bk Natl T Co
Purchase Details
Closed on
Jan 16, 1996
Sold by
Wagemann Albert F
Bought by
Cavaretta Henry M
Create a Home Valuation Report for This Property
The Home Valuation Report is an in-depth analysis detailing your home's value as well as a comparison with similar homes in the area
Home Values in the Area
Average Home Value in this Area
Purchase History
| Date | Buyer | Sale Price | Title Company |
|---|---|---|---|
| Kelly Moores Ret 2024 | -- | None Available | |
| Kelly Moores Ret 2024 | -- | None Available | |
| Moores Kelly A | $260,000 | -- | |
| Moores Kelly A | $260,000 | -- | |
| Deutsche Bk Natl T Co | $303,900 | -- | |
| Deutsche Bk Natl T Co | $303,900 | -- | |
| Cavaretta Henry M | $130,000 | -- | |
| Cavaretta Henry M | $130,000 | -- |
Source: Public Records
Mortgage History
| Date | Status | Borrower | Loan Amount |
|---|---|---|---|
| Previous Owner | Cavaretta Henry M | $217,000 | |
| Previous Owner | Cavaretta Henry M | $223,500 | |
| Previous Owner | Cavaretta Henry M | $230,000 |
Source: Public Records
Tax History
| Year | Tax Paid | Tax Assessment Tax Assessment Total Assessment is a certain percentage of the fair market value that is determined by local assessors to be the total taxable value of land and additions on the property. | Land | Improvement |
|---|---|---|---|---|
| 2024 | $5,049 | $583,000 | $381,400 | $201,600 |
| 2023 | $4,681 | $583,000 | $381,400 | $201,600 |
| 2022 | $4,069 | $583,000 | $381,400 | $201,600 |
| 2021 | $4,100 | $401,200 | $270,100 | $131,100 |
| 2020 | $4,317 | $401,200 | $270,100 | $131,100 |
| 2019 | $4,100 | $401,200 | $270,100 | $131,100 |
| 2018 | $4,358 | $387,900 | $270,100 | $117,800 |
| 2017 | $7,819 | $387,900 | $270,100 | $117,800 |
| 2016 | $3,392 | $317,600 | $184,200 | $133,400 |
| 2013 | $3,469 | $316,200 | $184,200 | $132,000 |
Source: Public Records
Map
Nearby Homes
- 14 Sagamore Rd Unit 3
- 4 Sagamore Rd
- 104 Odiorne Point Rd
- 239 Gosport Rd
- 1155 Sagamore Ave Unit 2
- 236 Sagamore Rd
- 267 Pioneer Rd
- 137 Clark Rd
- 389 Sagamore Rd
- 75 Marina Heights Rd
- 417 Lafayette Rd
- 763 Ocean Blvd
- 1 Pheasant Ln
- 889 South St Unit 4
- 2075 Lafayette Rd Unit A23
- 1193 Ocean Blvd
- 352 Miller Ave Unit 2
- 292 Wibird St
- 1215 Ocean Blvd Unit 5
- 150 Us Highway 1 Bypass Unit 209
Your Personal Tour Guide
Ask me questions while you tour the home.