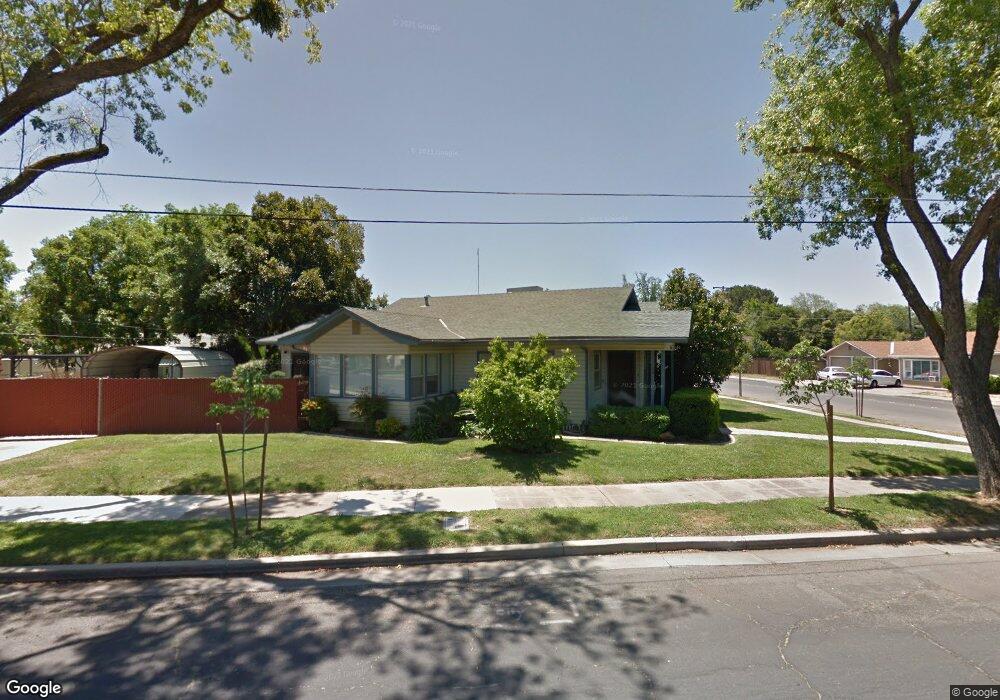
700 E 22nd St Merced, CA 95340
Estimated Value: $281,233 - $337,000
2
Beds
1
Bath
1,516
Sq Ft
$209/Sq Ft
Est. Value
About This Home
This home is located at 700 E 22nd St, Merced, CA 95340 and is currently estimated at $317,558, approximately $209 per square foot. 700 E 22nd St is a home located in Merced County with nearby schools including Charles Wright Elementary School, Herbert Hoover Middle School, and Golden Valley High School.
Ownership History
Date
Name
Owned For
Owner Type
Purchase Details
Closed on
Nov 14, 2020
Sold by
Smith James A
Bought by
Smith James A and Dilodovico Lucas M
Current Estimated Value
Home Financials for this Owner
Home Financials are based on the most recent Mortgage that was taken out on this home.
Original Mortgage
$192,000
Interest Rate
2.8%
Mortgage Type
New Conventional
Purchase Details
Closed on
Feb 22, 2006
Sold by
Smith James A
Bought by
Smith James A
Home Financials for this Owner
Home Financials are based on the most recent Mortgage that was taken out on this home.
Original Mortgage
$200,000
Interest Rate
6.15%
Mortgage Type
Stand Alone Refi Refinance Of Original Loan
Create a Home Valuation Report for This Property
The Home Valuation Report is an in-depth analysis detailing your home's value as well as a comparison with similar homes in the area
Purchase History
| Date | Buyer | Sale Price | Title Company |
|---|---|---|---|
| Smith James A | -- | Placer Title Company | |
| Smith James A | -- | Alliance Title Company |
Source: Public Records
Mortgage History
| Date | Status | Borrower | Loan Amount |
|---|---|---|---|
| Closed | Smith James A | $192,000 | |
| Closed | Smith James A | $200,000 |
Source: Public Records
Tax History
| Year | Tax Paid | Tax Assessment Tax Assessment Total Assessment is a certain percentage of the fair market value that is determined by local assessors to be the total taxable value of land and additions on the property. | Land | Improvement |
|---|---|---|---|---|
| 2025 | $1,344 | $132,872 | $41,519 | $91,353 |
| 2024 | $1,344 | $130,267 | $40,705 | $89,562 |
| 2023 | $1,324 | $127,713 | $39,907 | $87,806 |
| 2022 | $1,304 | $125,210 | $39,125 | $86,085 |
| 2021 | $1,300 | $122,756 | $38,358 | $84,398 |
| 2020 | $1,307 | $121,498 | $37,965 | $83,533 |
| 2019 | $1,287 | $119,117 | $37,221 | $81,896 |
| 2018 | $1,173 | $116,783 | $36,492 | $80,291 |
| 2017 | $1,215 | $114,494 | $35,777 | $78,717 |
| 2016 | $1,195 | $112,250 | $35,076 | $77,174 |
| 2015 | $1,175 | $110,565 | $34,550 | $76,015 |
| 2014 | $1,148 | $108,400 | $33,874 | $74,526 |
Source: Public Records
Map
Nearby Homes
Your Personal Tour Guide
Ask me questions while you tour the home.