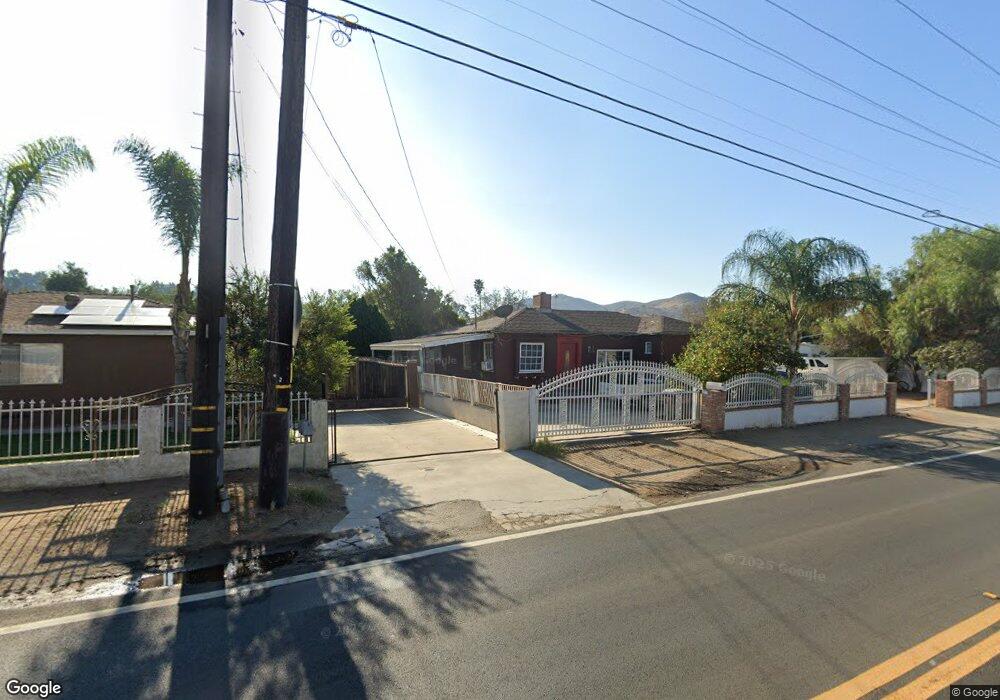
7000 Valley Way Riverside, CA 92509
Estimated Value: $599,000 - $710,000
3
Beds
3
Baths
2,820
Sq Ft
$236/Sq Ft
Est. Value
About This Home
This home is located at 7000 Valley Way, Riverside, CA 92509 and is currently estimated at $665,308, approximately $235 per square foot. 7000 Valley Way is a home located in Riverside County with nearby schools including Glen Avon Elementary School, Jurupa Middle School, and Patriot High School.
Ownership History
Date
Name
Owned For
Owner Type
Purchase Details
Closed on
Dec 27, 2023
Sold by
Marin Felipina
Bought by
Gonzalez Felipina Sandoval
Current Estimated Value
Purchase Details
Closed on
Jul 12, 2003
Sold by
Sandoval David
Bought by
Marin Felipina
Purchase Details
Closed on
Oct 24, 1995
Sold by
Sandoval Jose
Bought by
Sandoval David
Purchase Details
Closed on
Jul 14, 1995
Sold by
Rubalcaba Cuca Larios
Bought by
Larios Santiago
Home Financials for this Owner
Home Financials are based on the most recent Mortgage that was taken out on this home.
Original Mortgage
$5,000
Interest Rate
7.62%
Mortgage Type
Seller Take Back
Purchase Details
Closed on
Jul 13, 1995
Sold by
Sims General R and Wilson Marcille
Bought by
Sandoval David and Larios Santiago
Home Financials for this Owner
Home Financials are based on the most recent Mortgage that was taken out on this home.
Original Mortgage
$5,000
Interest Rate
7.62%
Mortgage Type
Seller Take Back
Create a Home Valuation Report for This Property
The Home Valuation Report is an in-depth analysis detailing your home's value as well as a comparison with similar homes in the area
Home Values in the Area
Average Home Value in this Area
Purchase History
| Date | Buyer | Sale Price | Title Company |
|---|---|---|---|
| Gonzalez Felipina Sandoval | -- | None Listed On Document | |
| Marin Felipina | -- | -- | |
| Sandoval David | -- | -- | |
| Larios Santiago | -- | Fidelity National Title Co | |
| Sandoval David | $55,000 | Fidelity National Title Co |
Source: Public Records
Mortgage History
| Date | Status | Borrower | Loan Amount |
|---|---|---|---|
| Previous Owner | Sandoval David | $5,000 |
Source: Public Records
Tax History Compared to Growth
Tax History
| Year | Tax Paid | Tax Assessment Tax Assessment Total Assessment is a certain percentage of the fair market value that is determined by local assessors to be the total taxable value of land and additions on the property. | Land | Improvement |
|---|---|---|---|---|
| 2025 | $3,797 | $355,423 | $71,076 | $284,347 |
| 2023 | $3,797 | $341,623 | $68,317 | $273,306 |
| 2022 | $3,713 | $334,926 | $66,978 | $267,948 |
| 2021 | $3,692 | $328,360 | $65,665 | $262,695 |
| 2020 | $3,656 | $324,994 | $64,992 | $260,002 |
| 2019 | $3,582 | $318,622 | $63,718 | $254,904 |
| 2018 | $3,465 | $312,375 | $62,469 | $249,906 |
| 2017 | $3,428 | $306,251 | $61,245 | $245,006 |
| 2016 | $3,379 | $300,247 | $60,045 | $240,202 |
| 2015 | $3,332 | $295,739 | $59,144 | $236,595 |
| 2014 | $3,105 | $289,948 | $57,987 | $231,961 |
Source: Public Records
Map
Nearby Homes
- 7081 Valley Way
- 7035 Jurupa Rd
- 0 Jewel St
- 4615 Fairbanks Ave
- 6661 Raven Cir
- 6916 36th St
- 6452 Mission Blvd
- 7411 Eddy Ave
- 3483 Skylane Dr
- 4688 Plaza Ln
- 4092 Sandpiper Dr
- 7319 Rocky Point Rd
- 7366 Rocky Point Rd
- 7153 Gypsum Dr
- 3318 Felisa Ct
- 6339 Rathke Dr
- 3325 Quarry Dr
- 7323 Garnet Ridge Rd
- 7340 Garnet Ridge Rd
- 3449 Mecosta Ct
- 6974 Valley Way
- 7008 Valley Way
- 7040 Valley Way
- 6919 Jurupa Rd
- 6961 Jurupa Rd
- 6927 Jurupa Rd
- 7021 Valley Way Unit 1
- 7057 Valley Way
- 6973 Jurupa Rd
- 6897 Jurupa Rd
- 6887 Jurupa Rd
- 7031 Jurupa Rd
- 7086 Valley Way
- 6877 Jurupa Rd
- 6946 Jurupa Rd
- 6920 Jurupa Rd
- 7092 Valley Way
- 6835 Jurupa Rd
- 6910 Jurupa Rd
- 6988 Mission Blvd