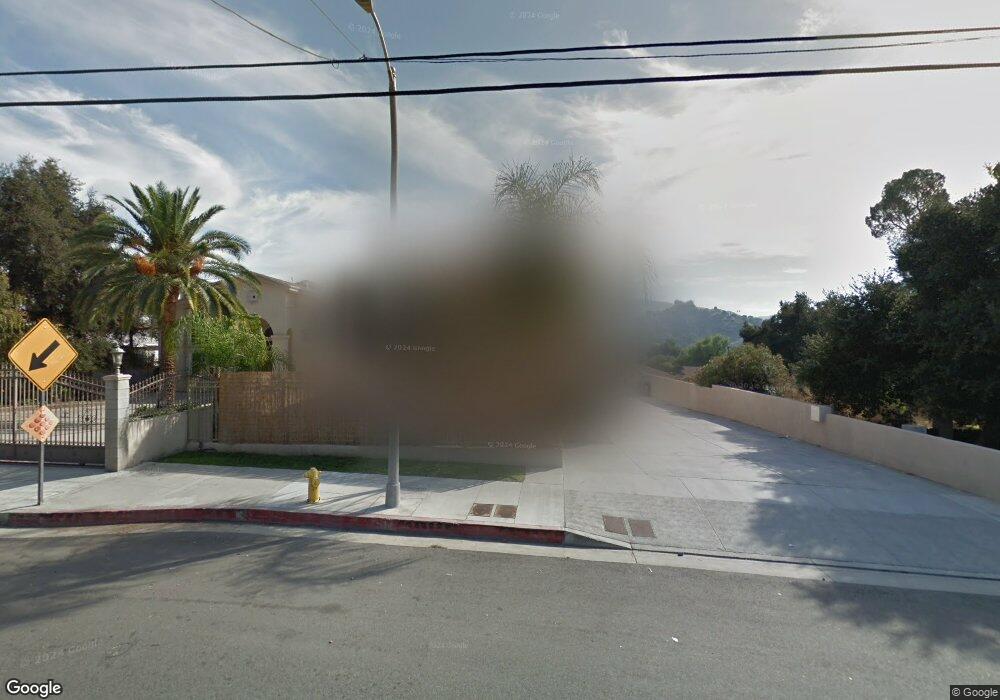
7006 Valmont St Unit A Tujunga, CA 91042
Estimated Value: $777,558 - $876,000
4
Beds
3
Baths
1,740
Sq Ft
$480/Sq Ft
Est. Value
About This Home
This home is located at 7006 Valmont St Unit A, Tujunga, CA 91042 and is currently estimated at $834,890, approximately $479 per square foot. 7006 Valmont St Unit A is a home located in Los Angeles County with nearby schools including Pinewood Avenue Elementary School, Mt. Gleason Middle School, and Verdugo Hills Senior High School.
Ownership History
Date
Name
Owned For
Owner Type
Purchase Details
Closed on
Nov 17, 2023
Sold by
Halcheva Donna G and Halcheva Emil V
Bought by
Halchev Family Trust and Halchev
Current Estimated Value
Purchase Details
Closed on
Dec 1, 2017
Sold by
Halchev Emil
Bought by
Halcheva Donna
Purchase Details
Closed on
Sep 9, 2015
Sold by
Valmont Elmo Llc
Bought by
Halchev Emil and Halcheva Donna
Home Financials for this Owner
Home Financials are based on the most recent Mortgage that was taken out on this home.
Original Mortgage
$400,000
Interest Rate
3.78%
Mortgage Type
Purchase Money Mortgage
Purchase Details
Closed on
Dec 30, 2010
Sold by
Lavaei Faramarz
Bought by
Valmont Elmo Llc
Create a Home Valuation Report for This Property
The Home Valuation Report is an in-depth analysis detailing your home's value as well as a comparison with similar homes in the area
Home Values in the Area
Average Home Value in this Area
Purchase History
| Date | Buyer | Sale Price | Title Company |
|---|---|---|---|
| Halchev Family Trust | -- | None Listed On Document | |
| Halcheva Donna | -- | Accommodation | |
| Halchev Emil | $490,000 | North American Title Company | |
| Valmont Elmo Llc | -- | None Available | |
| Lavaei Faramarz | $2,844,000 | None Available |
Source: Public Records
Mortgage History
| Date | Status | Borrower | Loan Amount |
|---|---|---|---|
| Previous Owner | Halchev Emil | $400,000 |
Source: Public Records
Tax History
| Year | Tax Paid | Tax Assessment Tax Assessment Total Assessment is a certain percentage of the fair market value that is determined by local assessors to be the total taxable value of land and additions on the property. | Land | Improvement |
|---|---|---|---|---|
| 2025 | $7,041 | $580,051 | $230,126 | $349,925 |
| 2024 | $7,041 | $568,678 | $225,614 | $343,064 |
| 2023 | $6,904 | $557,529 | $221,191 | $336,338 |
| 2022 | $6,581 | $546,598 | $216,854 | $329,744 |
| 2021 | $6,493 | $535,881 | $212,602 | $323,279 |
| 2019 | $6,297 | $519,990 | $206,298 | $313,692 |
| 2018 | $6,205 | $509,795 | $202,253 | $307,542 |
| 2017 | $6,089 | $499,800 | $198,288 | $301,512 |
| 2016 | $5,940 | $490,000 | $194,400 | $295,600 |
| 2015 | $5,301 | $429,384 | $216,184 | $213,200 |
| 2014 | $4,677 | $368,000 | $185,000 | $183,000 |
Source: Public Records
Map
Nearby Homes
- 7006 Valmont St Unit B
- 6911 Valmont St
- 7049 Sunnycrest Trail
- 7025 Day St
- 6834 Haywood St
- 7123 Greeley St Unit 102
- 6834 Quinton Ln
- 0 Haines Canyon Ave
- 10214 Samoa Ave Unit 25
- 9938 Commerce Ave
- 0 Tujunga Unit SR26033907
- 7115 Shadygrove St
- 0 Foothill Blvd
- 0 Commerce Ave
- 10139 Hillhaven Ave
- 7122 High Cliff Trail
- 7128 High Cliff Trail
- 9810 Hillhaven Ave
- 10274 Tujunga Canyon Blvd Unit 4
- 7225 Apperson St Unit 105
- 6949 Elmo St Unit C
- 6949 Elmo St Unit B
- 6949 Elmo St Unit A
- 6949 Elmo St Unit D
- 6949 Elmo #C
- 7006 Valmont St Unit C
- 7000 Valmont St
- 7018 Valmont St
- 6934 Valmont St
- 7005 Elmo St
- 7000 Elmo St
- 10033 Fairgrove Ave
- 6938 Valmont St
- 10027 Fairgrove Ave
- 6940 Valmont St
- 6930 Valmont St Unit 4
- 6930 Valmont St Unit 3
- 6930 Valmont St Unit 2
- 6930 Valmont St
- 7026 Valmont St Unit B
Your Personal Tour Guide
Ask me questions while you tour the home.