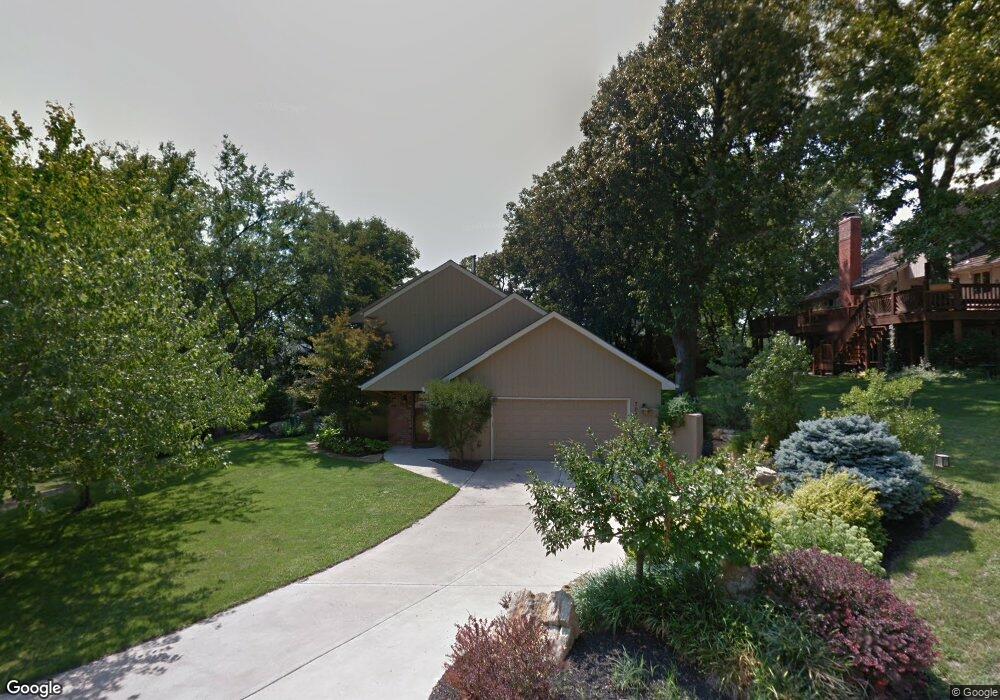
7007 Clairborne Ct Shawnee, KS 66217
Estimated Value: $391,000 - $458,000
4
Beds
3
Baths
2,367
Sq Ft
$176/Sq Ft
Est. Value
About This Home
This home is located at 7007 Clairborne Ct, Shawnee, KS 66217 and is currently estimated at $416,850, approximately $176 per square foot. 7007 Clairborne Ct is a home located in Johnson County with nearby schools including Lenexa Hills Elementary School, Trailridge Middle School, and Shawnee Mission Northwest High School.
Ownership History
Date
Name
Owned For
Owner Type
Purchase Details
Closed on
May 10, 2024
Sold by
Beatty Denise A
Bought by
Denise A Beatty Trust and Beatty
Current Estimated Value
Home Financials for this Owner
Home Financials are based on the most recent Mortgage that was taken out on this home.
Original Mortgage
$55,000
Outstanding Balance
$48,580
Interest Rate
6.82%
Mortgage Type
New Conventional
Estimated Equity
$368,270
Purchase Details
Closed on
May 2, 2023
Sold by
Beatty Denise A
Bought by
Denise A Beatty Trust
Purchase Details
Closed on
Feb 21, 2011
Sold by
Ramus Sebastien and Ramus Christine
Bought by
Beatty Denise A
Home Financials for this Owner
Home Financials are based on the most recent Mortgage that was taken out on this home.
Original Mortgage
$166,500
Interest Rate
4.7%
Mortgage Type
New Conventional
Create a Home Valuation Report for This Property
The Home Valuation Report is an in-depth analysis detailing your home's value as well as a comparison with similar homes in the area
Home Values in the Area
Average Home Value in this Area
Purchase History
| Date | Buyer | Sale Price | Title Company |
|---|---|---|---|
| Denise A Beatty Trust | -- | None Listed On Document | |
| Beatty Denise A | -- | None Listed On Document | |
| Denise A Beatty Trust | -- | None Listed On Document | |
| Beatty Denise A | -- | Kansas City Title |
Source: Public Records
Mortgage History
| Date | Status | Borrower | Loan Amount |
|---|---|---|---|
| Open | Beatty Denise A | $55,000 | |
| Previous Owner | Beatty Denise A | $166,500 |
Source: Public Records
Tax History
| Year | Tax Paid | Tax Assessment Tax Assessment Total Assessment is a certain percentage of the fair market value that is determined by local assessors to be the total taxable value of land and additions on the property. | Land | Improvement |
|---|---|---|---|---|
| 2025 | $4,297 | $41,860 | $8,216 | $33,644 |
| 2024 | $4,297 | $40,595 | $8,216 | $32,379 |
| 2023 | $4,232 | $39,468 | $7,498 | $31,970 |
| 2022 | $3,878 | $36,041 | $7,498 | $28,543 |
| 2021 | $3,658 | $31,901 | $7,498 | $24,403 |
| 2020 | $3,537 | $30,441 | $6,813 | $23,628 |
| 2019 | $3,460 | $29,762 | $6,186 | $23,576 |
| 2018 | $3,379 | $28,946 | $6,186 | $22,760 |
| 2017 | $3,121 | $26,312 | $5,373 | $20,939 |
| 2016 | $3,100 | $25,806 | $5,373 | $20,433 |
| 2015 | $2,925 | $25,266 | $5,373 | $19,893 |
| 2013 | -- | $21,275 | $5,373 | $15,902 |
Source: Public Records
Map
Nearby Homes
- 6913 Red Oak Dr
- 17730 W 68th Terrace
- 6739 Oak Ridge Dr
- 7031 Oak Ridge Dr
- 6905 Central St
- 7615 Eicher Dr
- 7203 Allman Dr
- 7229 Allman Dr
- 6040 Renner Rd
- 7239 Allman Rd
- 7221 Allman Rd
- 7237 Allman Rd
- 19403 W 64th Terrace
- 15832 W 61st St
- 15715 W 62nd St
- 15722 W 61st Terrace
- 19500 W 65th Terrace
- 16122 W 80th St
- 14913 W 71st Terrace
- 14910 W 65th St
- 17317 W 70th St
- 7011 Clairborne Ct
- 17407 W 70th St
- 17411 W 70th St
- 7012 Clairborne Ct
- 17309 W 70th St
- 7015 Clairborne Ct
- 0 W 70th St Unit 1856739
- 17316 W 70th St
- 17415 W 70th St
- 7022 Clairborne Ct
- 17301 W 70th St
- 17404 W 70th St
- 17308 W 70th St
- 7019 Clairborne Ct
- 17429 W 70th St
- 6907 Mill Creek Rd
- 17412 W 70th St
- 17241 W 70th St
Your Personal Tour Guide
Ask me questions while you tour the home.