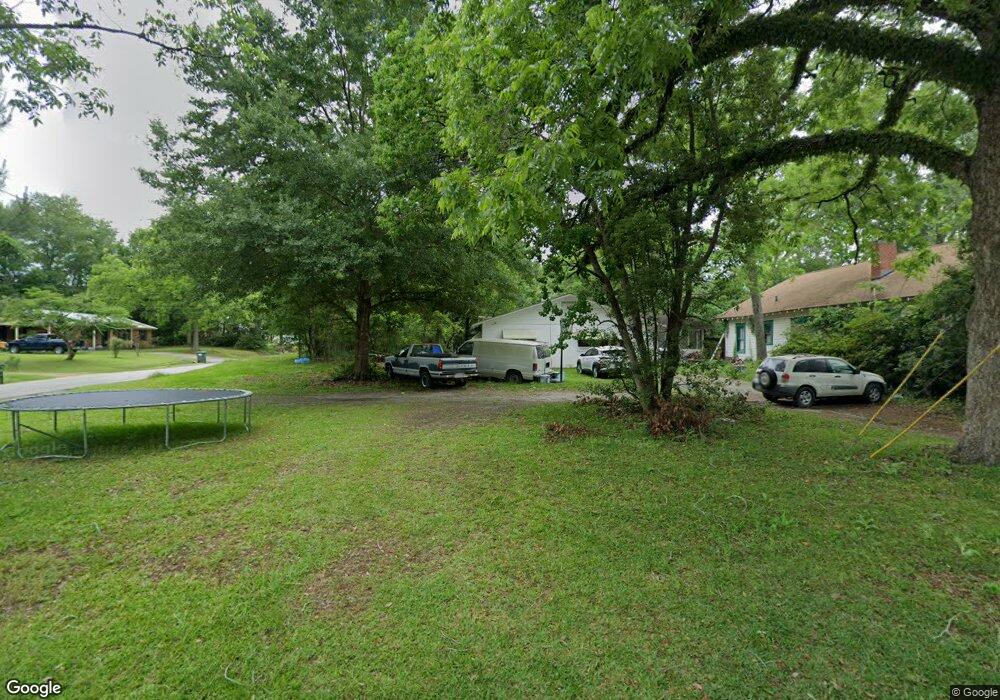
700A N Barnes St Quitman, GA 31643
Estimated Value: $70,240 - $224,000
3
Beds
2
Baths
1,815
Sq Ft
$72/Sq Ft
Est. Value
About This Home
This home is located at 700A N Barnes St, Quitman, GA 31643 and is currently estimated at $130,080, approximately $71 per square foot. 700A N Barnes St is a home located in Brooks County with nearby schools including Quitman Elementary School and First Baptist Church Preschool & Kindergarten.
Ownership History
Date
Name
Owned For
Owner Type
Purchase Details
Closed on
May 26, 2006
Sold by
Selby Bettye B
Bought by
Dailey Caulie L
Current Estimated Value
Home Financials for this Owner
Home Financials are based on the most recent Mortgage that was taken out on this home.
Original Mortgage
$62,508
Interest Rate
6.5%
Mortgage Type
New Conventional
Purchase Details
Closed on
Mar 23, 1998
Sold by
Dailey Caulie L and Dailey Bettye L
Bought by
Dailey Caulie L
Purchase Details
Closed on
May 18, 1993
Sold by
Secretary Of Veterans Affairs
Bought by
Dailey Caulie L and Dailey Bettye L
Purchase Details
Closed on
Nov 12, 1991
Sold by
National First Mortgage Corp Of Penn
Bought by
Secretary Of Veterans Affairs
Purchase Details
Closed on
Mar 13, 1984
Sold by
Bowen J W
Bought by
Demott Thomas P and Demott Dana
Create a Home Valuation Report for This Property
The Home Valuation Report is an in-depth analysis detailing your home's value as well as a comparison with similar homes in the area
Home Values in the Area
Average Home Value in this Area
Purchase History
| Date | Buyer | Sale Price | Title Company |
|---|---|---|---|
| Dailey Caulie L | -- | -- | |
| Jones Tyrell D | $55,000 | -- | |
| Dailey Caulie L | -- | -- | |
| Dailey Caulie L | -- | -- | |
| Secretary Of Veterans Affairs | -- | -- | |
| National First Mortgage Corp Of Penn | $35,500 | -- | |
| Demott Thomas P | -- | -- |
Source: Public Records
Mortgage History
| Date | Status | Borrower | Loan Amount |
|---|---|---|---|
| Closed | Jones Tyrell D | $62,508 |
Source: Public Records
Tax History Compared to Growth
Tax History
| Year | Tax Paid | Tax Assessment Tax Assessment Total Assessment is a certain percentage of the fair market value that is determined by local assessors to be the total taxable value of land and additions on the property. | Land | Improvement |
|---|---|---|---|---|
| 2025 | $335 | $10,240 | $2,320 | $7,920 |
| 2024 | $335 | $10,240 | $2,320 | $7,920 |
| 2023 | $318 | $9,720 | $2,320 | $7,400 |
| 2022 | $286 | $8,080 | $2,280 | $5,800 |
| 2021 | $248 | $6,880 | $2,280 | $4,600 |
| 2020 | $243 | $6,880 | $2,280 | $4,600 |
| 2019 | $229 | $7,520 | $3,080 | $4,440 |
| 2018 | $288 | $7,920 | $3,080 | $4,840 |
| 2017 | $241 | $7,800 | $3,240 | $4,560 |
| 2016 | $238 | $7,800 | $3,240 | $4,560 |
| 2015 | -- | $13,680 | $3,240 | $10,440 |
| 2014 | -- | $14,000 | $3,240 | $10,760 |
| 2013 | -- | $22,360 | $3,240 | $19,120 |
Source: Public Records
Map
Nearby Homes
- 602 N Webster St
- 304 W Rountree St
- 606 N Court St
- 1002 N Madison St
- 621 N Court St
- 903 W Hill St
- 2434 Dunn Rd
- 309 Eastlake Dr
- 000 E Gordon St
- 804 Westlake Dr
- 103 Victorian Way
- 714 Morris Ave
- 1306 E Screven St
- 84 W Us
- 1540 Dunn Rd
- 7747 Empress Rd
- 237 Turkey Ridge Ln
- 5036 Hamlin Rd
- 5199 U S 84
- 0 Spencer Rd
- 700 N Barnes St
- 618 N Barnes St
- 1003 Roundtree St
- 1004 Roundtree St
- 905 Mitchell Ave
- 621 N Barnes St
- 907 Mitchell Ave
- 1005 Roundtree St
- 616 N Barnes St
- 619 N Barnes St
- 1006 Roundtree St
- 909 Mitchell Ave
- 608 N Webster St
- 617 N Barnes St
- 800 N Webster St
- 639 Barwick Rd
- 627 Barwick Rd
- 614 N Barnes St
- 701 Barwick Rd
- 906 Mitchell Ave