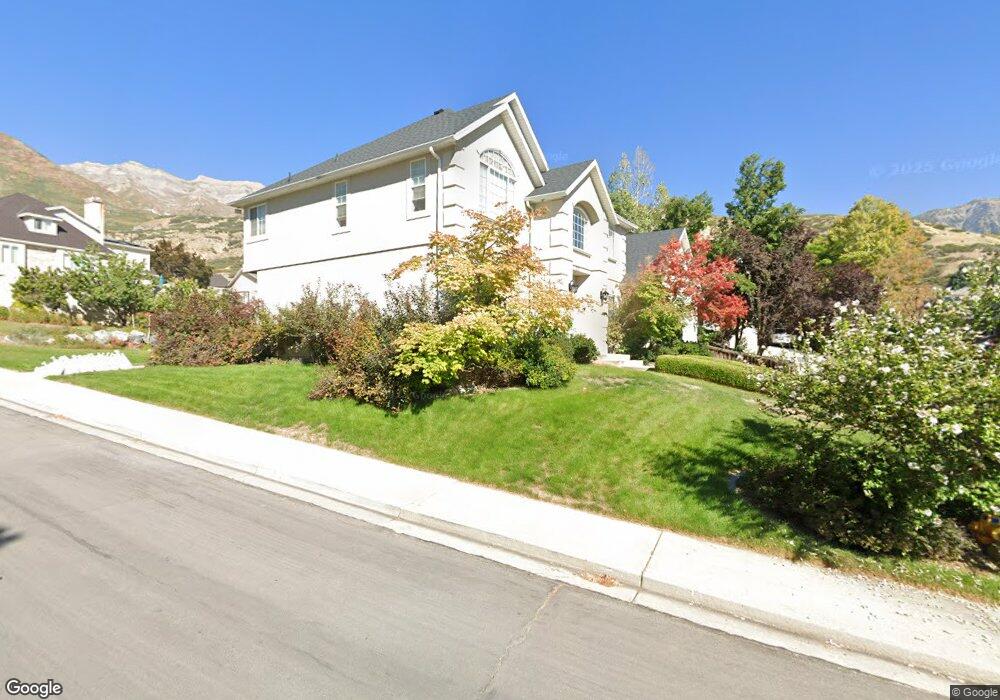
701 E 1950 N Orem, UT 84097
Northridge NeighborhoodEstimated Value: $821,352 - $967,000
4
Beds
3
Baths
3,569
Sq Ft
$250/Sq Ft
Est. Value
About This Home
This home is located at 701 E 1950 N, Orem, UT 84097 and is currently estimated at $893,784, approximately $250 per square foot. 701 E 1950 N is a home located in Utah County with nearby schools including Orchard Elementary School, Oak Canyon Junior High School, and Timpanogos High School.
Ownership History
Date
Name
Owned For
Owner Type
Purchase Details
Closed on
Oct 3, 2025
Sold by
Sorensen Susan Lee
Bought by
Susan L Sorensen Trust and Sorensen
Current Estimated Value
Purchase Details
Closed on
Aug 24, 2010
Sold by
Sorensen Kris A and Sorensen Susan Lee
Bought by
Sorensen Susan Lee
Home Financials for this Owner
Home Financials are based on the most recent Mortgage that was taken out on this home.
Original Mortgage
$303,200
Interest Rate
4.52%
Mortgage Type
New Conventional
Purchase Details
Closed on
Mar 8, 2001
Sold by
Harper Stephen M and Harper Karen
Bought by
Sorensen Kris A and Sorensen Susan Lee
Home Financials for this Owner
Home Financials are based on the most recent Mortgage that was taken out on this home.
Original Mortgage
$275,000
Interest Rate
7.12%
Create a Home Valuation Report for This Property
The Home Valuation Report is an in-depth analysis detailing your home's value as well as a comparison with similar homes in the area
Home Values in the Area
Average Home Value in this Area
Purchase History
| Date | Buyer | Sale Price | Title Company |
|---|---|---|---|
| Susan L Sorensen Trust | -- | None Listed On Document | |
| Sorensen Susan Lee | -- | Atlas Title Salt Lake | |
| Sorensen Kris A | -- | First American Title Co |
Source: Public Records
Mortgage History
| Date | Status | Borrower | Loan Amount |
|---|---|---|---|
| Previous Owner | Sorensen Susan Lee | $303,200 | |
| Previous Owner | Sorensen Kris A | $275,000 |
Source: Public Records
Tax History
| Year | Tax Paid | Tax Assessment Tax Assessment Total Assessment is a certain percentage of the fair market value that is determined by local assessors to be the total taxable value of land and additions on the property. | Land | Improvement |
|---|---|---|---|---|
| 2025 | $3,556 | $463,210 | -- | -- |
| 2024 | $3,556 | $434,885 | $0 | $0 |
| 2023 | $3,434 | $451,275 | $0 | $0 |
| 2022 | $3,422 | $435,655 | $0 | $0 |
| 2021 | $3,116 | $600,900 | $191,800 | $409,100 |
| 2020 | $2,936 | $556,400 | $166,800 | $389,600 |
| 2019 | $2,506 | $494,000 | $155,200 | $338,800 |
| 2018 | $2,557 | $481,600 | $155,200 | $326,400 |
| 2017 | $2,559 | $258,115 | $0 | $0 |
| 2016 | $2,766 | $257,290 | $0 | $0 |
| 2015 | $2,748 | $241,780 | $0 | $0 |
| 2014 | $2,587 | $226,545 | $0 | $0 |
Source: Public Records
Map
Nearby Homes
- 695 E 1870 N
- 110 S 1320 E
- 540 E Quail Rd
- 1643 N Mountain Oaks Dr
- 723 E 1450 N Unit 25
- 713 E 1500 St N Unit 19
- 747 E 1500 N Unit 13
- 1480 N 430 E
- 1366 N 750 E
- 713 E 1450 N Unit 23
- 1356 N 750 E Unit 11
- 733 E 1450 N Unit 5
- 1324 N 750 E Unit 3
- 1636 N 160 E
- 1638 N 160 E
- 1051 E 100 N
- 363 E 1395 N Unit 22
- 710 E 1280 N
- 120 N 950 E
- 1371 N 330 E Unit 8
Your Personal Tour Guide
Ask me questions while you tour the home.