N
Seller's Agent in 2018
New Neighbor Realty Team
EXIT Realty All Stars
3 in this area
74 Total Sales

Estimated Value: $619,000 - $705,000
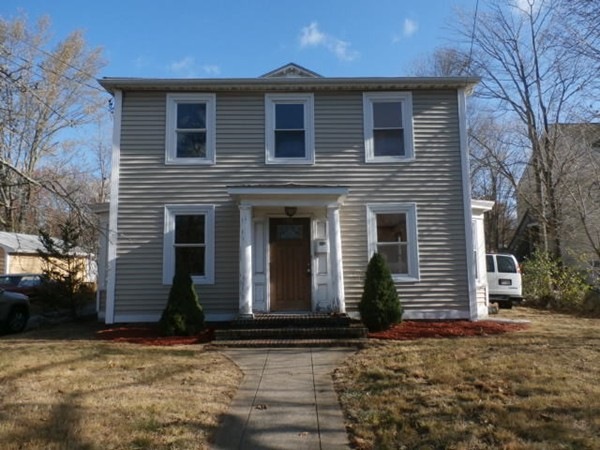
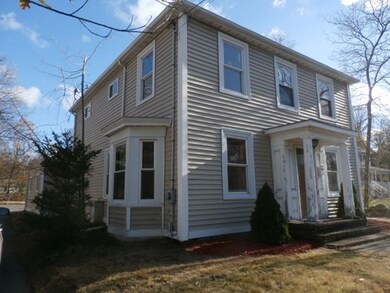
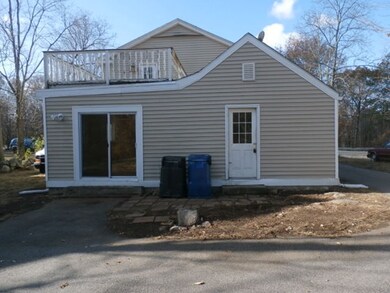
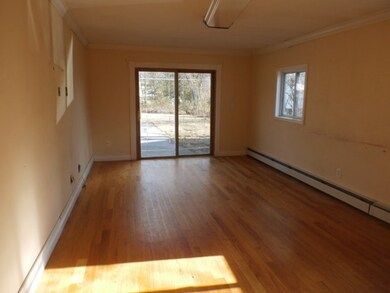
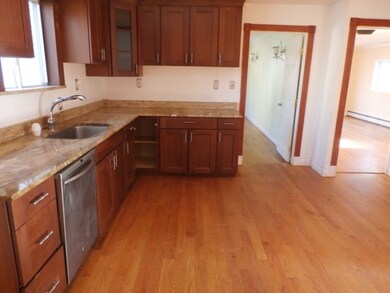
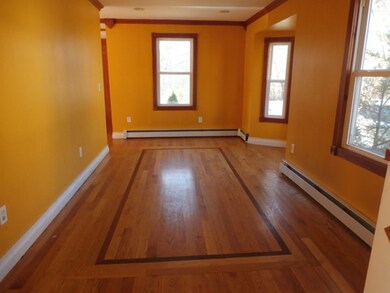
Back on market buyer's financing fell through. This home is striking with its front pillars and back roof deck. 4 bedrooms, a bonus room and a partial finished basement. Lots of room for a family to grow! Beautiful decorative hardwood floors. Located not far from the center and close to highway access and commuter rail. Home has historical ties to the Wilbur's theater. This is a Homepath property!
Last Agent to Sell the Property
EXIT Realty All Stars Listed on: 11/15/2017

Home Type
Single Family
Year Built
1850
Lot Details
0.29 Acres
| Date | Buyer | Sale Price | Title Company |
|---|---|---|---|
| Telusma Joseph | -- | -- | |
| Federal National Mortgage Association | $277,370 | -- | |
| Diligent Claudnys | $400,000 | -- | |
| Lam David | $230,000 | -- |
| Date | Status | Borrower | Loan Amount |
|---|---|---|---|
| Open | Telusma Joseph | $392,755 | |
| Previous Owner | Diligent Claudnys | $400,000 |
| Date | Event | Price | List to Sale | Price per Sq Ft |
|---|---|---|---|---|
| 03/30/2018 03/30/18 | Sold | $400,000 | 0.0% | $195 / Sq Ft |
| 02/16/2018 02/16/18 | Pending | -- | -- | -- |
| 02/14/2018 02/14/18 | Price Changed | $399,900 | -2.4% | $195 / Sq Ft |
| 01/24/2018 01/24/18 | For Sale | $409,900 | 0.0% | $200 / Sq Ft |
| 11/21/2017 11/21/17 | Pending | -- | -- | -- |
| 11/15/2017 11/15/17 | For Sale | $409,900 | -- | $200 / Sq Ft |
| Year | Tax Paid | Tax Assessment Tax Assessment Total Assessment is a certain percentage of the fair market value that is determined by local assessors to be the total taxable value of land and additions on the property. | Land | Improvement |
|---|---|---|---|---|
| 2025 | $7,015 | $604,200 | $230,800 | $373,400 |
| 2024 | $6,904 | $603,000 | $226,300 | $376,700 |
| 2023 | $6,384 | $528,500 | $205,800 | $322,700 |
| 2022 | $6,255 | $459,900 | $171,500 | $288,400 |
| 2021 | $6,010 | $406,600 | $142,800 | $263,800 |
| 2020 | $5,714 | $383,200 | $142,800 | $240,400 |
| 2019 | $5,185 | $346,100 | $136,100 | $210,000 |
| 2018 | $4,972 | $313,100 | $123,600 | $189,500 |
| 2017 | $4,972 | $307,300 | $117,800 | $189,500 |
| 2016 | $4,787 | $275,300 | $107,100 | $168,200 |
| 2015 | $4,561 | $252,000 | $102,000 | $150,000 |
N
Seller's Agent in 2018
New Neighbor Realty Team
EXIT Realty All Stars
3 in this area
74 Total Sales
Buyer's Agent in 2018
Jerry Smith
LDS Realty Group, Inc.
(857) 246-2764
3 in this area
45 Total Sales
Source: MLS Property Information Network (MLS PIN)
MLS Number: 72255846
APN: RAND-000023-D000000-000015
Disclaimer: Certain information contained herein is derived from information provided by parties other than Homes.com. All information provided is deemed reliable, but is not guaranteed to be accurate and should be independently verified.
![]() The property listing data and information, or the Images, set forth herein were provided to MLS Property Information Network, Inc. from third party sources, including sellers, lessors and public records, and were compiled by MLS Property Information Network, Inc. The property listing data and information, and the Images, are for the personal, non-commercial use of consumers having a good faith interest in purchasing or leasing listed properties of the type displayed to them and may not be used for any purpose other than to identify prospective properties which such consumers may have a good faith interest in purchasing or leasing. MLS Property Information Network, Inc. and its subscribers disclaim any and all representations and warranties as to the accuracy of the property listing data and information, or as to the accuracy of any of the Images, set forth herein.
The property listing data and information, or the Images, set forth herein were provided to MLS Property Information Network, Inc. from third party sources, including sellers, lessors and public records, and were compiled by MLS Property Information Network, Inc. The property listing data and information, and the Images, are for the personal, non-commercial use of consumers having a good faith interest in purchasing or leasing listed properties of the type displayed to them and may not be used for any purpose other than to identify prospective properties which such consumers may have a good faith interest in purchasing or leasing. MLS Property Information Network, Inc. and its subscribers disclaim any and all representations and warranties as to the accuracy of the property listing data and information, or as to the accuracy of any of the Images, set forth herein.
Ask me questions while you tour the home.