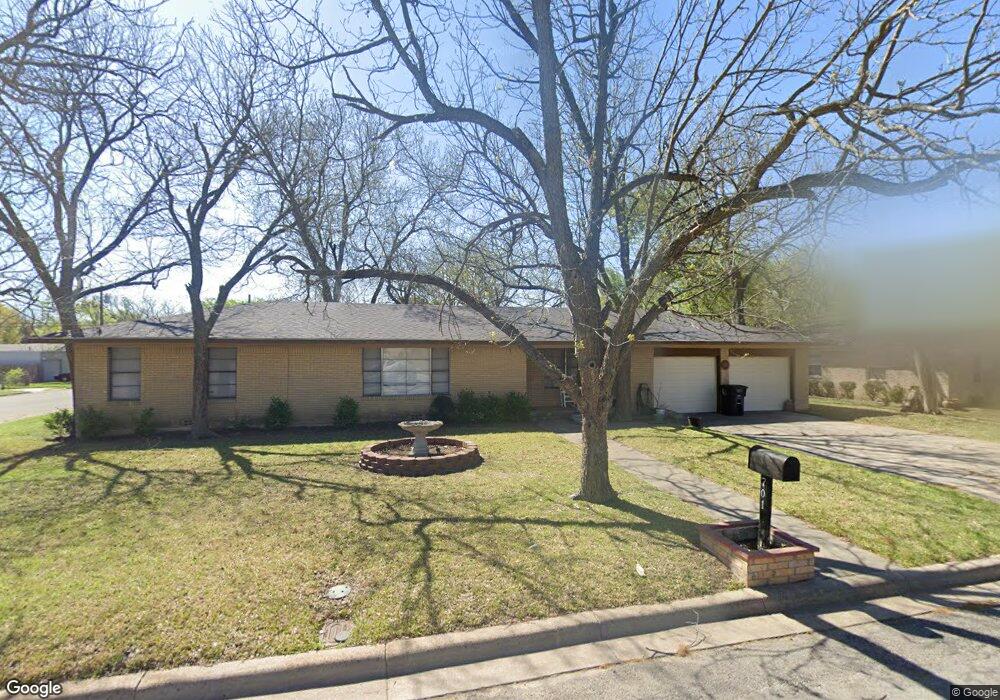
701 Phillips St Cleburne, TX 76033
Estimated Value: $206,000 - $238,000
3
Beds
1
Bath
1,650
Sq Ft
$136/Sq Ft
Est. Value
About This Home
This home is located at 701 Phillips St, Cleburne, TX 76033 and is currently estimated at $224,651, approximately $136 per square foot. 701 Phillips St is a home located in Johnson County with nearby schools including Cooke Elementary School, A.D. Wheat Middle School, and Cleburne High School.
Ownership History
Date
Name
Owned For
Owner Type
Purchase Details
Closed on
Dec 12, 2017
Sold by
Garcia Henry and Garcia Maria Elena
Bought by
Garcia Henry
Current Estimated Value
Purchase Details
Closed on
Jun 22, 2011
Sold by
Staples Paul R and Staples Margaret L
Bought by
Garcia Henry
Home Financials for this Owner
Home Financials are based on the most recent Mortgage that was taken out on this home.
Original Mortgage
$76,500
Interest Rate
4.7%
Mortgage Type
Purchase Money Mortgage
Purchase Details
Closed on
Jan 16, 2008
Sold by
Woolley Larry and Stanford Audrey Fay
Bought by
Staples Paul R and Staples Margaret L
Home Financials for this Owner
Home Financials are based on the most recent Mortgage that was taken out on this home.
Original Mortgage
$65,000
Interest Rate
6.11%
Mortgage Type
Purchase Money Mortgage
Create a Home Valuation Report for This Property
The Home Valuation Report is an in-depth analysis detailing your home's value as well as a comparison with similar homes in the area
Home Values in the Area
Average Home Value in this Area
Purchase History
| Date | Buyer | Sale Price | Title Company |
|---|---|---|---|
| Garcia Henry | -- | None Available | |
| Garcia Henry | -- | None Available | |
| Staples Paul R | -- | Fatco |
Source: Public Records
Mortgage History
| Date | Status | Borrower | Loan Amount |
|---|---|---|---|
| Closed | Garcia Henry | $76,500 | |
| Previous Owner | Staples Paul R | $65,000 |
Source: Public Records
Tax History Compared to Growth
Tax History
| Year | Tax Paid | Tax Assessment Tax Assessment Total Assessment is a certain percentage of the fair market value that is determined by local assessors to be the total taxable value of land and additions on the property. | Land | Improvement |
|---|---|---|---|---|
| 2025 | $1,846 | $222,962 | $40,000 | $182,962 |
| 2024 | $3,173 | $142,307 | $0 | $0 |
| 2023 | $1,569 | $222,962 | $40,000 | $182,962 |
| 2022 | $2,943 | $189,166 | $35,250 | $153,916 |
| 2021 | $2,790 | $106,917 | $30,500 | $76,417 |
| 2020 | $3,227 | $130,569 | $22,000 | $108,569 |
| 2019 | $3,129 | $130,569 | $22,000 | $108,569 |
| 2018 | $2,845 | $103,917 | $27,500 | $76,417 |
| 2017 | $2,576 | $103,917 | $27,500 | $76,417 |
| 2016 | $2,342 | $79,551 | $20,000 | $59,551 |
| 2015 | $1,826 | $79,551 | $20,000 | $59,551 |
| 2014 | $1,826 | $79,551 | $20,000 | $59,551 |
Source: Public Records
Map
Nearby Homes
- 603 Lilly St
- 810 Euclid St
- 808 Marengo St
- 805 Marengo St
- 905 Euclid St
- 902 Turner St
- Robin Plan at Craftsman's Corner
- Cardinal Plan at Craftsman's Corner
- Sherwood Plan at Craftsman's Corner
- Essex Plan at Craftsman's Corner
- Hanover Plan at Craftsman's Corner
- 433 Rose Ave
- 508 Bales St
- 418 Marengo St
- 502 Bales St
- 426 Rose Ave
- 916 Poindexter Ave
- 800 Madison St
- 422 Rose Ave
- 413 Rose Ave
- 705 Phillips St
- 707 Phillips St
- 609 Phillips St
- 700 Euclid St
- 709 Phillips St
- 702 Phillips St
- 607 Phillips St
- 614 Euclid St
- 706 Euclid St
- 711 Phillips St
- 706 Phillips St
- 708 Euclid St
- 612 Euclid St
- 605 Phillips St
- 713 Phillips St
- 608 Phillips St
- 712 Euclid St
- 610 Euclid St
- 708 Phillips St
- 715 Phillips St