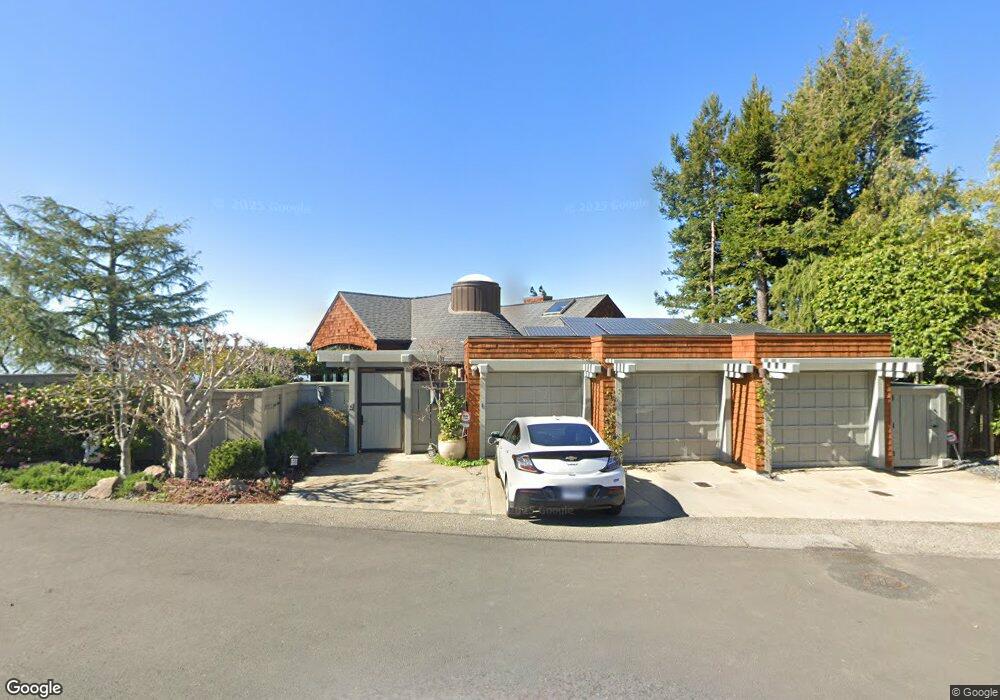
7011 Devon Way Berkeley, CA 94705
Claremont Hills NeighborhoodEstimated Value: $866,000 - $1,969,750
3
Beds
4
Baths
3,720
Sq Ft
$370/Sq Ft
Est. Value
About This Home
This home is located at 7011 Devon Way, Berkeley, CA 94705 and is currently estimated at $1,377,438, approximately $370 per square foot. 7011 Devon Way is a home located in Alameda County with nearby schools including Chabot Elementary School, Thornhill Elementary School, and Claremont Middle School.
Ownership History
Date
Name
Owned For
Owner Type
Purchase Details
Closed on
Mar 27, 2007
Sold by
Nitzberg Kenneth E and Nitzberg Joanne M
Bought by
Nitzberg Kenneth E and Nitzberg Joanne M
Current Estimated Value
Purchase Details
Closed on
Jun 7, 2006
Sold by
Moreno Gordon Leonard and Moreno Gordon Rita
Bought by
Moreno Gordon Leonard L and Moreno Gordon Rita
Create a Home Valuation Report for This Property
The Home Valuation Report is an in-depth analysis detailing your home's value as well as a comparison with similar homes in the area
Home Values in the Area
Average Home Value in this Area
Purchase History
| Date | Buyer | Sale Price | Title Company |
|---|---|---|---|
| Nitzberg Kenneth E | -- | None Available | |
| Moreno Gordon Leonard L | -- | None Available |
Source: Public Records
Tax History
| Year | Tax Paid | Tax Assessment Tax Assessment Total Assessment is a certain percentage of the fair market value that is determined by local assessors to be the total taxable value of land and additions on the property. | Land | Improvement |
|---|---|---|---|---|
| 2025 | $7,640 | $488,385 | $73,635 | $421,750 |
| 2024 | $7,640 | $478,673 | $72,191 | $413,482 |
| 2023 | $7,994 | $476,151 | $70,776 | $405,375 |
| 2022 | $7,862 | $459,815 | $69,388 | $397,427 |
| 2021 | $7,561 | $450,663 | $68,028 | $389,635 |
| 2020 | $7,476 | $452,971 | $67,331 | $385,640 |
| 2019 | $7,164 | $444,090 | $66,011 | $378,079 |
| 2018 | $7,022 | $435,383 | $64,716 | $370,667 |
| 2017 | $6,732 | $426,848 | $63,447 | $363,401 |
| 2016 | $6,606 | $418,480 | $62,203 | $356,277 |
| 2015 | $6,688 | $412,196 | $61,269 | $350,927 |
| 2014 | $6,738 | $404,122 | $60,069 | $344,053 |
Source: Public Records
Map
Nearby Homes
- 7041 Devon Way
- 0 Buckingham Blvd Unit 41115384
- 7003 Buckingham Blvd
- 7084 Westmoorland Dr
- 6971 Bristol Dr
- 6716 Charing Cross Rd
- 280 Caldecott Ln Unit 221
- 6839 Sherwick Dr
- 1881 Grand View Dr
- 1102 Grand View Dr
- 0 Dartmouth Dr
- 29 Live Oak Rd
- 1426 Grand View Dr
- 320 Caldecott Ln Unit 127
- 320 Caldecott Ln Unit 116
- 180 Caldecott Ln Unit 314
- 1215 Alvarado Rd
- 0 Gypsy Ln
- 1375 Alvarado Rd
- 1383 Alvarado Rd
- 7027 Devon Way
- 7016 Devon Way
- 7026 Devon Way
- 7020 Devon Way
- 7000 Devon Way
- 7047 Devon Way
- 7026 Devon Way
- 7028 Devon Way
- 6959 Norfolk Rd
- 6951 Norfolk Rd
- 7001 Norfolk Rd
- 7030 Devon Way Unit 1
- 7030 Devon Way
- 7051 Devon Way
- 7050 Devon Way
- 7026 Norfolk Rd
- 7018 Norfolk Rd
- 7000 Norfolk Rd
- 7030 Norfolk Rd
- 6948 Norfolk Rd
Your Personal Tour Guide
Ask me questions while you tour the home.