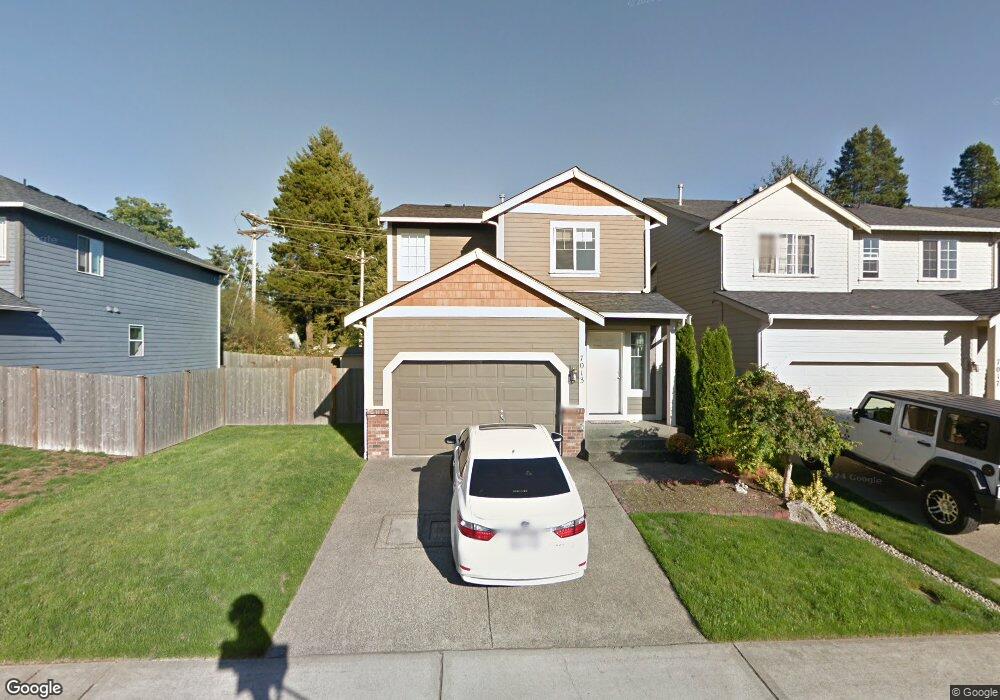
7013 Golden Given Rd E Tacoma, WA 98404
Eastside NeighborhoodEstimated Value: $466,000 - $529,000
4
Beds
3
Baths
1,840
Sq Ft
$269/Sq Ft
Est. Value
About This Home
This home is located at 7013 Golden Given Rd E, Tacoma, WA 98404 and is currently estimated at $495,380, approximately $269 per square foot. 7013 Golden Given Rd E is a home located in Pierce County with nearby schools including Boze, First Creek Middle School, and Lincoln High School.
Ownership History
Date
Name
Owned For
Owner Type
Purchase Details
Closed on
Aug 21, 2013
Sold by
Piano Christopher
Bought by
Vankunthea
Current Estimated Value
Home Financials for this Owner
Home Financials are based on the most recent Mortgage that was taken out on this home.
Original Mortgage
$149,572
Outstanding Balance
$108,882
Interest Rate
3.87%
Mortgage Type
FHA
Estimated Equity
$386,498
Purchase Details
Closed on
Jun 24, 2009
Sold by
Piano Dovangchay
Bought by
Piano Christopher
Home Financials for this Owner
Home Financials are based on the most recent Mortgage that was taken out on this home.
Original Mortgage
$238,009
Interest Rate
4.83%
Mortgage Type
VA
Purchase Details
Closed on
Mar 20, 2009
Sold by
Sound Built Homes Inc
Bought by
First Mutual Bank
Create a Home Valuation Report for This Property
The Home Valuation Report is an in-depth analysis detailing your home's value as well as a comparison with similar homes in the area
Home Values in the Area
Average Home Value in this Area
Purchase History
| Date | Buyer | Sale Price | Title Company |
|---|---|---|---|
| Vankunthea | $157,500 | Stewart Title | |
| Piano Christopher | -- | Chicago Title Insurance Co | |
| Piano Christopher | $233,000 | Chicago Title Insurance Co | |
| First Mutual Bank | $1,600,000 | 1St American |
Source: Public Records
Mortgage History
| Date | Status | Borrower | Loan Amount |
|---|---|---|---|
| Open | Vankunthea | $149,572 | |
| Previous Owner | Piano Christopher | $238,009 |
Source: Public Records
Tax History Compared to Growth
Tax History
| Year | Tax Paid | Tax Assessment Tax Assessment Total Assessment is a certain percentage of the fair market value that is determined by local assessors to be the total taxable value of land and additions on the property. | Land | Improvement |
|---|---|---|---|---|
| 2025 | $4,734 | $483,100 | $170,400 | $312,700 |
| 2024 | $4,734 | $458,200 | $163,900 | $294,300 |
| 2023 | $4,734 | $425,200 | $157,500 | $267,700 |
| 2022 | $4,288 | $435,000 | $167,200 | $267,800 |
| 2021 | $4,010 | $318,900 | $103,700 | $215,200 |
| 2019 | $3,544 | $291,600 | $86,600 | $205,000 |
| 2018 | $3,905 | $272,600 | $70,300 | $202,300 |
| 2017 | $3,456 | $247,200 | $52,400 | $194,800 |
| 2016 | $2,998 | $189,500 | $39,800 | $149,700 |
| 2014 | $2,558 | $172,400 | $36,300 | $136,100 |
| 2013 | $2,558 | $153,700 | $32,300 | $121,400 |
Source: Public Records
Map
Nearby Homes
- 241 E 71st St
- 405 E 71st St
- 249 E 71st St
- 245 E 71st St
- 1216 E 70th St
- 1202 E 72nd St
- 7428 12th Ave E
- 1311 E 68th St
- 6610 E Mckinley Ave
- 7426 Portland Ave E
- 6965 E E St
- 7704 Golden Given Rd E
- 1028 E 64th St
- 601 E 75th St
- 7009 E D St
- 7802 Golden Given Rd E
- 816 E 64th St
- 1426 E 65th St
- 7412 E E St
- 6502 E Portland Ave
- 7017 Golden Given Rd E
- 7009 Golden Given Rd E
- 7021 Golden Given Rd E
- 7005 Golden Given Rd E
- 7001 Golden Given Rd E
- 7012 Golden Given Rd E Unit 70
- 7012 Golden Given Rd E
- 7008 Golden Given Rd E Unit 69
- 7008 Golden Given Rd E
- 7025 Golden Given Rd E
- 7020 Golden Given Rd E Unit 72
- 7020 Golden Given Rd E
- 1008 E 70th St Unit 68
- 1008 E 70th St
- 1103 E 71st St
- 7024 Golden Given Rd E
- 1025 E 70th St
- 7028 Golden Given Rd E