Estimated Value: $318,000 - $355,000
4
Beds
5
Baths
2,000
Sq Ft
$166/Sq Ft
Est. Value
About This Home
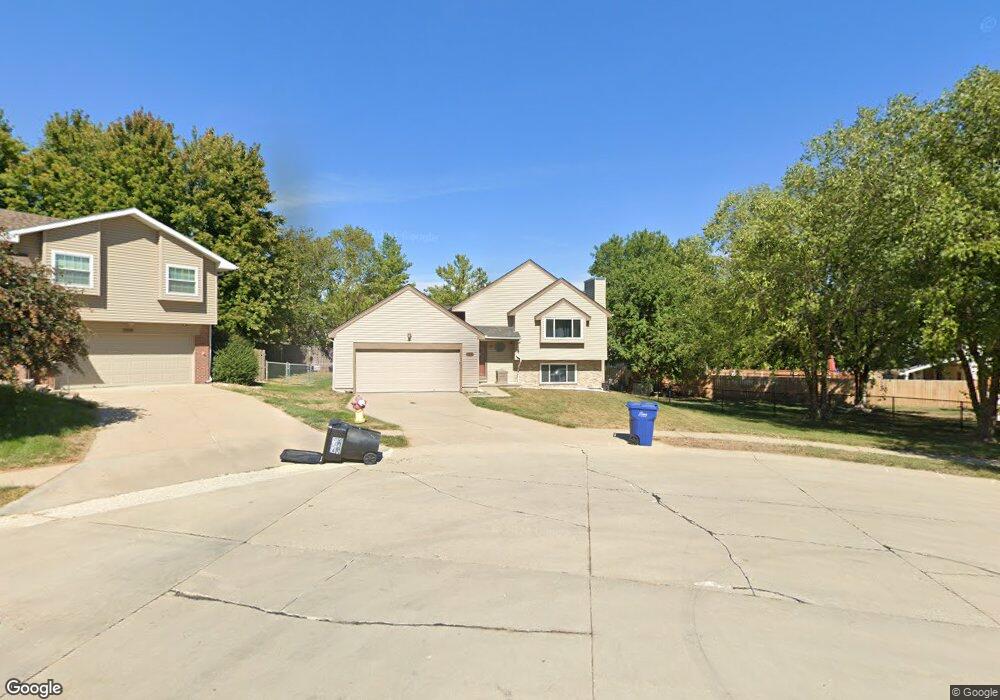
This home is located at 7013 S 155th Cr, Omaha, NE 68138 and is currently estimated at $332,450, approximately $166 per square foot. 7013 S 155th Cr is a home located in Sarpy County with nearby schools including Neihardt Elementary School, Millard South High School, and Harry Andersen Middle School.
Ownership History
Date
Name
Owned For
Owner Type
Purchase Details
Closed on
Aug 15, 2007
Sold by
Agnew Jerome and Agnew Pandora B
Bought by
Jackson Richard E and Jackson Sara Christine
Current Estimated Value
Home Financials for this Owner
Home Financials are based on the most recent Mortgage that was taken out on this home.
Original Mortgage
$153,900
Outstanding Balance
$97,342
Interest Rate
6.64%
Estimated Equity
$235,108
Purchase Details
Closed on
Jul 8, 2004
Sold by
Battey Matthew J
Bought by
Agnew Jerome and Agnew Pandora
Home Financials for this Owner
Home Financials are based on the most recent Mortgage that was taken out on this home.
Original Mortgage
$158,400
Interest Rate
6.26%
Purchase Details
Closed on
Jul 21, 1998
Sold by
Buchanan Lynne M and Nuno Eric
Bought by
Battery Matthew J
Home Financials for this Owner
Home Financials are based on the most recent Mortgage that was taken out on this home.
Original Mortgage
$107,100
Interest Rate
7%
Create a Home Valuation Report for This Property
The Home Valuation Report is an in-depth analysis detailing your home's value as well as a comparison with similar homes in the area
Home Values in the Area
Average Home Value in this Area
Purchase History
| Date | Buyer | Sale Price | Title Company |
|---|---|---|---|
| Jackson Richard E | $162,000 | Superior Title & Escrow Llc | |
| Agnew Jerome | $155,000 | -- | |
| Battery Matthew J | $119,000 | -- |
Source: Public Records
Mortgage History
| Date | Status | Borrower | Loan Amount |
|---|---|---|---|
| Open | Jackson Richard E | $153,900 | |
| Closed | Agnew Jerome | $158,400 | |
| Previous Owner | Battery Matthew J | $107,100 |
Source: Public Records
Tax History Compared to Growth
Tax History
| Year | Tax Paid | Tax Assessment Tax Assessment Total Assessment is a certain percentage of the fair market value that is determined by local assessors to be the total taxable value of land and additions on the property. | Land | Improvement |
|---|---|---|---|---|
| 2025 | $4,535 | $294,398 | $47,000 | $247,398 |
| 2024 | $4,832 | $274,944 | $45,000 | $229,944 |
| 2023 | $4,832 | $246,151 | $37,000 | $209,151 |
| 2022 | $4,426 | $209,030 | $37,000 | $172,030 |
| 2021 | $4,022 | $187,857 | $35,000 | $152,857 |
| 2020 | $4,041 | $182,339 | $30,000 | $152,339 |
| 2019 | $3,672 | $165,322 | $30,000 | $135,322 |
| 2018 | $3,635 | $160,548 | $25,000 | $135,548 |
| 2017 | $3,502 | $154,899 | $25,000 | $129,899 |
| 2016 | $3,417 | $150,248 | $25,000 | $125,248 |
| 2015 | $3,370 | $147,346 | $25,000 | $122,346 |
| 2014 | $3,309 | $144,286 | $25,000 | $119,286 |
| 2012 | -- | $141,820 | $25,000 | $116,820 |
Source: Public Records
Map
Nearby Homes
- 6916 S 154th St
- 7006 S 154th St
- 6735 S 153rd Cir
- 7011 S 156th Avenue Cir
- 6734 S 152nd St
- 6505 S 154th St
- 15534 Newell St
- 15219 Madison St
- 14926 Edna St
- 6441 S 159th Ave
- 6523 S 150th St
- 14910 Edna St
- 6212 S 158th St
- 15818 Timberlane Dr
- 6511 S 149th Ave
- 14743 Gertrude St
- 14911 Jefferson Cir
- 14728 Gertrude St
- 16113 Josephine St
- 14712 Gertrude St
- 7013 S 155th Cir
- 15427 Karloff Cir
- 15422 Gertrude St
- 7009 S 155th Cir
- 15418 Gertrude St
- 15431 Karloff Cir
- 7012 S 155th Cir
- 15414 Gertrude St
- 6912 S 154th St
- 15435 Karloff Cir
- 7016 S 155th Cir
- 7020 S 155th Cir
- 7109 S 155th St
- 7002 S 154th St
- 7008 154
- 15432 Karloff Cir
- 7010 154
- 6913 S 154th St
- 6917 S 154th St
- 15511 Gertrude St