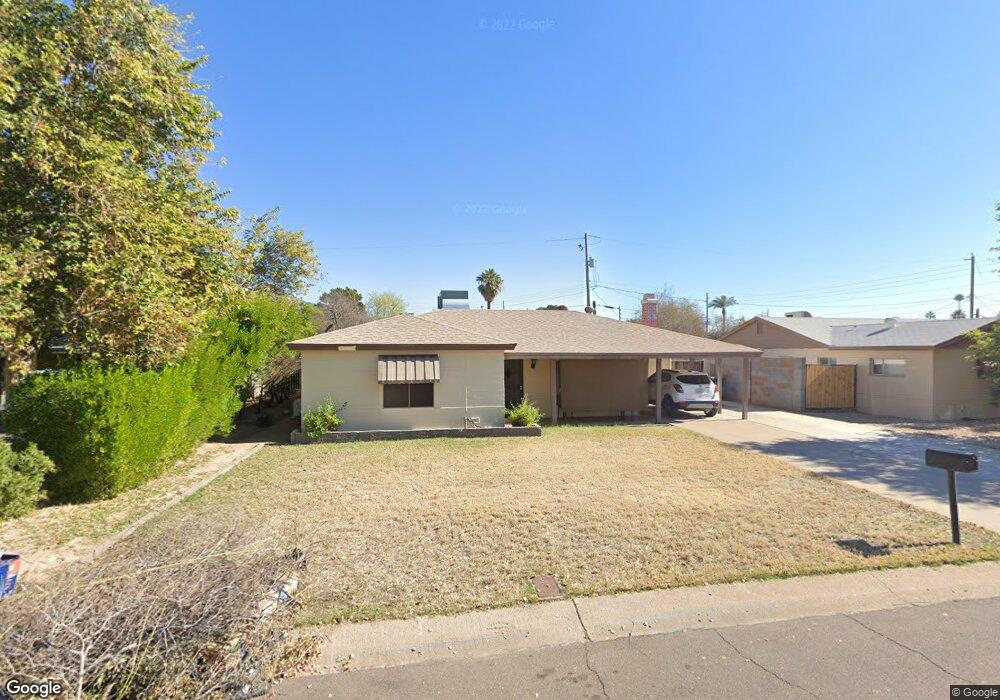
7019 N 11th Place Phoenix, AZ 85020
Camelback East Village NeighborhoodEstimated Value: $381,069 - $506,000
--
Bed
1
Bath
1,336
Sq Ft
$347/Sq Ft
Est. Value
About This Home
This home is located at 7019 N 11th Place, Phoenix, AZ 85020 and is currently estimated at $463,017, approximately $346 per square foot. 7019 N 11th Place is a home located in Maricopa County with nearby schools including Madison Richard Simis School, Madison Meadows School, and Phoenix Coding Academy.
Ownership History
Date
Name
Owned For
Owner Type
Purchase Details
Closed on
Apr 17, 1998
Sold by
Lawcock Max
Bought by
Lawcock Alice Louise
Current Estimated Value
Home Financials for this Owner
Home Financials are based on the most recent Mortgage that was taken out on this home.
Original Mortgage
$84,560
Outstanding Balance
$16,164
Interest Rate
7.18%
Mortgage Type
FHA
Estimated Equity
$446,853
Purchase Details
Closed on
Apr 7, 1998
Sold by
Lawcock Alice Louise
Bought by
Walters Sean B and Walters Lori A
Home Financials for this Owner
Home Financials are based on the most recent Mortgage that was taken out on this home.
Original Mortgage
$84,560
Outstanding Balance
$16,164
Interest Rate
7.18%
Mortgage Type
FHA
Estimated Equity
$446,853
Purchase Details
Closed on
Mar 26, 1997
Sold by
Stroud Sheri
Bought by
Lawcock Suzanne Louise and Lawcock Alice Louise
Purchase Details
Closed on
Mar 25, 1997
Sold by
Lawcock Suzanne Louise
Bought by
Stroud Sheri
Create a Home Valuation Report for This Property
The Home Valuation Report is an in-depth analysis detailing your home's value as well as a comparison with similar homes in the area
Home Values in the Area
Average Home Value in this Area
Purchase History
| Date | Buyer | Sale Price | Title Company |
|---|---|---|---|
| Lawcock Alice Louise | -- | Grand Canyon Title Agency In | |
| Walters Sean B | $85,000 | Grand Canyon Title Agency In | |
| Lawcock Suzanne Louise | -- | -- | |
| Stroud Sheri | -- | -- |
Source: Public Records
Mortgage History
| Date | Status | Borrower | Loan Amount |
|---|---|---|---|
| Open | Walters Sean B | $84,560 |
Source: Public Records
Tax History Compared to Growth
Tax History
| Year | Tax Paid | Tax Assessment Tax Assessment Total Assessment is a certain percentage of the fair market value that is determined by local assessors to be the total taxable value of land and additions on the property. | Land | Improvement |
|---|---|---|---|---|
| 2025 | $1,765 | $15,390 | -- | -- |
| 2024 | $1,629 | $14,657 | -- | -- |
| 2023 | $1,629 | $35,070 | $7,010 | $28,060 |
| 2022 | $1,577 | $26,780 | $5,350 | $21,430 |
| 2021 | $1,609 | $25,220 | $5,040 | $20,180 |
| 2020 | $1,583 | $25,200 | $5,040 | $20,160 |
| 2019 | $1,547 | $23,300 | $4,660 | $18,640 |
| 2018 | $1,506 | $23,170 | $4,630 | $18,540 |
| 2017 | $1,430 | $21,060 | $4,210 | $16,850 |
| 2016 | $1,378 | $17,070 | $3,410 | $13,660 |
| 2015 | $1,283 | $14,450 | $2,890 | $11,560 |
Source: Public Records
Map
Nearby Homes
- 1106 E Glendale Ave
- 7022 N 11th St
- 1021 E Palmaire Ave
- 6819 N 10th Place Unit 2
- 6750 N 11th Place
- 1202 E Palmaire Ave
- 6741 N 10th St
- 1135 E Lawrence Rd
- 826 E Lamar Rd
- 6838 N 13th Place Unit 2
- 1139 E Ocotillo Rd
- 846 E Ocotillo Rd
- 7232 N 13th St
- 6729 N 13th St
- 6767 N 7th St Unit 227
- 6820 N 14th St
- 6814 N 14th St
- 7350 N 11th St
- 6544 N 12th St Unit 19
- 6640 N Chatelaine Place
- 7013 N 11th Place
- 7023 N 11th Place Unit 3
- 7020 N 11th Way
- 7024 N 11th Way
- 7014 N 11th Way
- 7007 N 11th Place
- 7029 N 11th Place
- 7020 N 11th Place
- 7014 N 11th Place
- 7030 N 11th Way
- 7008 N 11th Way
- 7026 N 11th Place
- 7003 N 11th Place
- 7010 N 11th Place Unit 3
- 7032 N 11th Place
- 7036 N 11th Way
- 7004 N 11th Place
- 7019 N 11th Way
- 7023 N 11th Way
- 7021 N 11th St