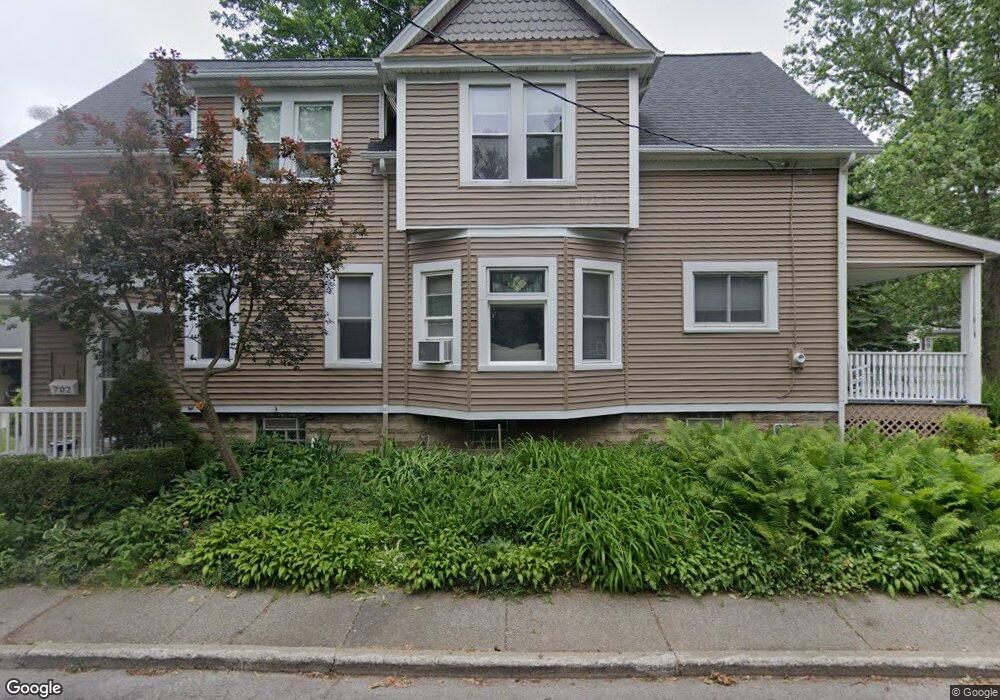
702 Main St West Seneca, NY 14224
Estimated Value: $287,000 - $307,000
3
Beds
3
Baths
1,660
Sq Ft
$179/Sq Ft
Est. Value
About This Home
This home is located at 702 Main St, West Seneca, NY 14224 and is currently estimated at $296,360, approximately $178 per square foot. 702 Main St is a home located in Erie County with nearby schools including East Middle School, West Seneca East Senior High School, and Queen Of Heaven Elementary School.
Ownership History
Date
Name
Owned For
Owner Type
Purchase Details
Closed on
Apr 30, 2019
Sold by
Parker Bradley L
Bought by
Parker Bradley L and Parker Carol
Current Estimated Value
Purchase Details
Closed on
Nov 13, 2008
Sold by
Sgranfetto Paul A and Sgranfetto Lauren R
Bought by
Parker Bradley L
Home Financials for this Owner
Home Financials are based on the most recent Mortgage that was taken out on this home.
Original Mortgage
$89,000
Interest Rate
5.8%
Mortgage Type
Purchase Money Mortgage
Create a Home Valuation Report for This Property
The Home Valuation Report is an in-depth analysis detailing your home's value as well as a comparison with similar homes in the area
Home Values in the Area
Average Home Value in this Area
Purchase History
| Date | Buyer | Sale Price | Title Company |
|---|---|---|---|
| Parker Bradley L | -- | None Available | |
| Parker Bradley L | $105,000 | None Available |
Source: Public Records
Mortgage History
| Date | Status | Borrower | Loan Amount |
|---|---|---|---|
| Closed | Parker Bradley L | $89,000 |
Source: Public Records
Tax History Compared to Growth
Tax History
| Year | Tax Paid | Tax Assessment Tax Assessment Total Assessment is a certain percentage of the fair market value that is determined by local assessors to be the total taxable value of land and additions on the property. | Land | Improvement |
|---|---|---|---|---|
| 2024 | $5,513 | $54,800 | $5,800 | $49,000 |
| 2023 | $5,417 | $54,800 | $5,800 | $49,000 |
| 2022 | $5,283 | $54,800 | $5,800 | $49,000 |
| 2021 | $5,245 | $54,800 | $5,800 | $49,000 |
| 2020 | $5,224 | $54,800 | $5,800 | $49,000 |
| 2019 | $5,066 | $54,800 | $5,800 | $49,000 |
| 2018 | $5,045 | $54,800 | $5,800 | $49,000 |
| 2017 | $2,425 | $54,800 | $5,800 | $49,000 |
| 2016 | $4,851 | $54,800 | $5,800 | $49,000 |
| 2015 | -- | $54,800 | $5,800 | $49,000 |
| 2014 | -- | $54,800 | $5,800 | $49,000 |
Source: Public Records
Map
Nearby Homes