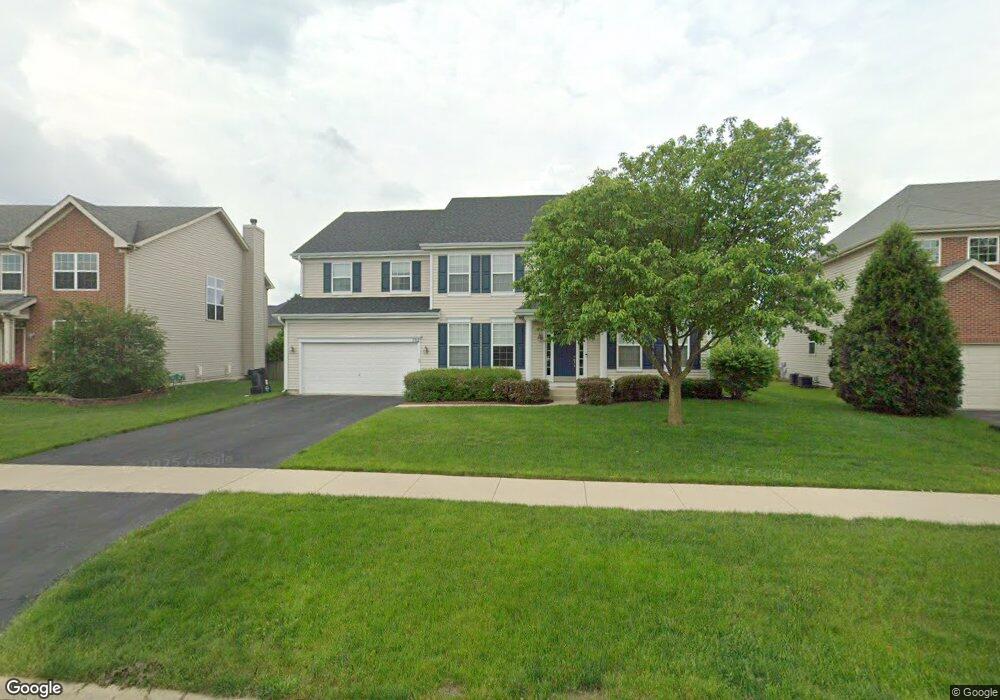
702 Mansfield Ct Oswego, IL 60543
South Oswego NeighborhoodEstimated Value: $535,000 - $568,000
4
Beds
4
Baths
3,400
Sq Ft
$160/Sq Ft
Est. Value
About This Home
This home is located at 702 Mansfield Ct, Oswego, IL 60543 and is currently estimated at $545,557, approximately $160 per square foot. 702 Mansfield Ct is a home located in Kendall County with nearby schools including Southbury Elementary School, Traughber Junior High School, and Oswego High School.
Ownership History
Date
Name
Owned For
Owner Type
Purchase Details
Closed on
Sep 16, 2021
Sold by
Riess Gregory W and Riess Natalie
Bought by
Riess Gregory W and Riess Natalie
Current Estimated Value
Purchase Details
Closed on
Feb 18, 2009
Sold by
Federal National Mortgage Association
Bought by
Riess Gregory W and Riess Natalie
Home Financials for this Owner
Home Financials are based on the most recent Mortgage that was taken out on this home.
Original Mortgage
$188,000
Interest Rate
5.11%
Mortgage Type
Purchase Money Mortgage
Purchase Details
Closed on
Dec 18, 2008
Sold by
Kaminsky Peter M and Kaminsky Rie
Bought by
Federal National Mortgage Association
Purchase Details
Closed on
Nov 8, 2005
Sold by
Realen Homes Lp
Bought by
Kaminsky Peter M and Kaminsky Rie
Home Financials for this Owner
Home Financials are based on the most recent Mortgage that was taken out on this home.
Original Mortgage
$277,910
Interest Rate
6.12%
Mortgage Type
New Conventional
Create a Home Valuation Report for This Property
The Home Valuation Report is an in-depth analysis detailing your home's value as well as a comparison with similar homes in the area
Home Values in the Area
Average Home Value in this Area
Purchase History
| Date | Buyer | Sale Price | Title Company |
|---|---|---|---|
| Riess Gregory W | -- | Attorney | |
| Riess Gregory W | $245,000 | Atg | |
| Federal National Mortgage Association | -- | None Available | |
| Kaminsky Peter M | $347,500 | Chicago Title Insurance Co |
Source: Public Records
Mortgage History
| Date | Status | Borrower | Loan Amount |
|---|---|---|---|
| Previous Owner | Riess Gregory W | $188,000 | |
| Previous Owner | Kaminsky Peter M | $277,910 |
Source: Public Records
Tax History Compared to Growth
Tax History
| Year | Tax Paid | Tax Assessment Tax Assessment Total Assessment is a certain percentage of the fair market value that is determined by local assessors to be the total taxable value of land and additions on the property. | Land | Improvement |
|---|---|---|---|---|
| 2024 | $11,002 | $142,717 | $39,776 | $102,941 |
| 2023 | $10,023 | $125,190 | $34,891 | $90,299 |
| 2022 | $10,023 | $117,000 | $32,608 | $84,392 |
| 2021 | $9,391 | $106,364 | $29,644 | $76,720 |
| 2020 | $8,739 | $98,485 | $27,448 | $71,037 |
| 2019 | $8,744 | $97,092 | $27,448 | $69,644 |
| 2018 | $9,518 | $100,022 | $28,276 | $71,746 |
| 2017 | $9,639 | $100,022 | $28,276 | $71,746 |
| 2016 | $9,237 | $94,808 | $26,802 | $68,006 |
| 2015 | $9,290 | $91,161 | $25,771 | $65,390 |
| 2014 | $4,568 | $86,001 | $24,312 | $61,689 |
| 2013 | $4,568 | $86,001 | $24,312 | $61,689 |
Source: Public Records
Map
Nearby Homes
- 521 Litchfield Way
- 621 Mansfield Way
- 633 Mansfield Way
- 555 Litchfield Way
- 1444 Vintage Dr
- 747 Fairfield Dr
- 749 Fairfield Dr
- 856 Preston Ln
- Lyndale Plan at Southbury
- 215 Willington Way
- Hudson Plan at Southbury
- Essex Plan at Southbury
- 858 Preston Ln
- 860 Preston Ln
- 450 Bower Ln
- 452 Bower Ln
- 454 Bower Ln
- 809 Canton Dr
- 420 Bower Ln
- 704 Pomfret Ct
- 704 Mansfield Ct
- 700 Mansfield Ct
- 606 Mansfield Way
- 513 Litchfield Way
- 515 Litchfield Way
- 706 Mansfield Ct
- 612 Mansfield Way
- 511 Litchfield Way
- 604 Mansfield Way
- 517 Litchfield Way
- 707 Mansfield Ct
- 708 Mansfield Ct
- 602 Mansfield Way
- 519 Litchfield Way
- 614 Mansfield Way
- 613 Mansfield Way
- 611 Mansfield Way
- 615 Mansfield Way
- 600 Mansfield Way
- 609 Mansfield Way