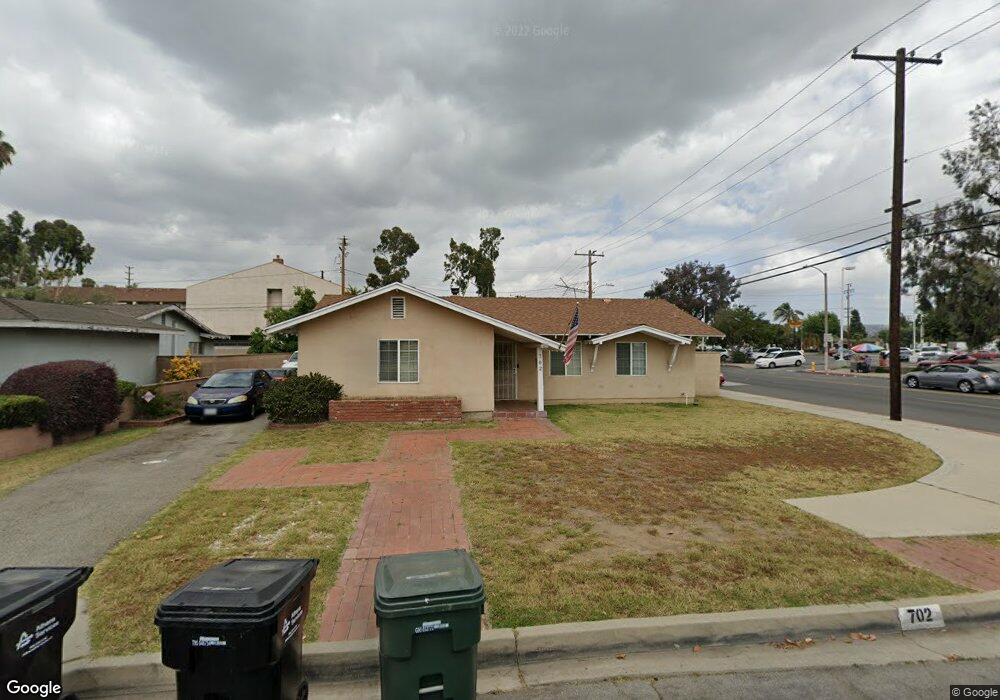
702 N Myrtlewood Ave West Covina, CA 91791
Estimated Value: $786,000 - $867,363
3
Beds
2
Baths
1,488
Sq Ft
$567/Sq Ft
Est. Value
About This Home
This home is located at 702 N Myrtlewood Ave, West Covina, CA 91791 and is currently estimated at $843,091, approximately $566 per square foot. 702 N Myrtlewood Ave is a home located in Los Angeles County with nearby schools including Grovecenter Elementary School, Traweek Middle School, and Covina High School.
Ownership History
Date
Name
Owned For
Owner Type
Purchase Details
Closed on
Mar 23, 2004
Sold by
Lucas Gregory B
Bought by
Lopez Jessie and Lopez Dianna Love
Current Estimated Value
Home Financials for this Owner
Home Financials are based on the most recent Mortgage that was taken out on this home.
Original Mortgage
$288,000
Outstanding Balance
$133,561
Interest Rate
5.56%
Mortgage Type
Purchase Money Mortgage
Estimated Equity
$709,530
Purchase Details
Closed on
Aug 17, 1999
Sold by
Lucas Kerry
Bought by
Lucas Gregory B
Home Financials for this Owner
Home Financials are based on the most recent Mortgage that was taken out on this home.
Original Mortgage
$108,750
Interest Rate
7.56%
Purchase Details
Closed on
Jul 20, 1999
Sold by
Dover Patricia C
Bought by
Lucas Gregory B
Home Financials for this Owner
Home Financials are based on the most recent Mortgage that was taken out on this home.
Original Mortgage
$108,750
Interest Rate
7.56%
Create a Home Valuation Report for This Property
The Home Valuation Report is an in-depth analysis detailing your home's value as well as a comparison with similar homes in the area
Home Values in the Area
Average Home Value in this Area
Purchase History
| Date | Buyer | Sale Price | Title Company |
|---|---|---|---|
| Lopez Jessie | $360,000 | -- | |
| Lucas Gregory B | -- | Benefit Land Title Company | |
| Lucas Gregory B | $145,000 | Benefit Land Title Company |
Source: Public Records
Mortgage History
| Date | Status | Borrower | Loan Amount |
|---|---|---|---|
| Open | Lopez Jessie | $288,000 | |
| Previous Owner | Lucas Gregory B | $108,750 |
Source: Public Records
Tax History Compared to Growth
Tax History
| Year | Tax Paid | Tax Assessment Tax Assessment Total Assessment is a certain percentage of the fair market value that is determined by local assessors to be the total taxable value of land and additions on the property. | Land | Improvement |
|---|---|---|---|---|
| 2025 | $6,450 | $511,824 | $341,219 | $170,605 |
| 2024 | $6,450 | $501,789 | $334,529 | $167,260 |
| 2023 | $6,356 | $491,951 | $327,970 | $163,981 |
| 2022 | $6,272 | $482,306 | $321,540 | $160,766 |
| 2021 | $6,179 | $472,850 | $315,236 | $157,614 |
| 2019 | $6,029 | $458,827 | $305,887 | $152,940 |
| 2018 | $5,705 | $449,832 | $299,890 | $149,942 |
| 2016 | $5,382 | $432,366 | $288,246 | $144,120 |
| 2015 | $5,239 | $425,873 | $283,917 | $141,956 |
| 2014 | $5,168 | $417,532 | $278,356 | $139,176 |
Source: Public Records
Map
Nearby Homes
- 708 N La Breda Ave
- 501 Embrook Way
- 509 Tamarind Way Unit B
- 229 Scratch Rd
- 1147 W Badillo St Unit G
- 1147 W Badillo St Unit D
- 543 W Puente St Unit 3
- 511 W Puente St Unit 4
- 511 W Puente St Unit 1
- 1122 W Glentana St
- 123 S Hollenbeck Ave
- 193 S Hollenbeck Ave
- 1714 E Idahome St
- 1327 E Thelborn St
- 1715 E Mardina St
- 650 N Vogue Ave
- 1626 E Mardina St
- 627 W Front St
- 17022 E Edna Place
- 577 S Albertson Ave
- 706 N Myrtlewood Ave
- 712 N Myrtlewood Ave
- 703 N Myrtlewood Ave
- 718 N Myrtlewood Ave
- 707 N Myrtlewood Ave
- 713 N Myrtlewood Ave
- 724 N Myrtlewood Ave
- 1651 E Puente Ave
- 1651 E Puente Ave
- 719 N Myrtlewood Ave
- 728 N Myrtlewood Ave
- 642 N Eileen Ave
- 1650 E Louisa Ave
- 1645 E Puente Ave
- 636 N Eileen Ave
- 734 N Myrtlewood Ave
- 729 N Myrtlewood Ave
- 1644 E Louisa Ave
- 1639 E Puente Ave
- 630 N Eileen Ave