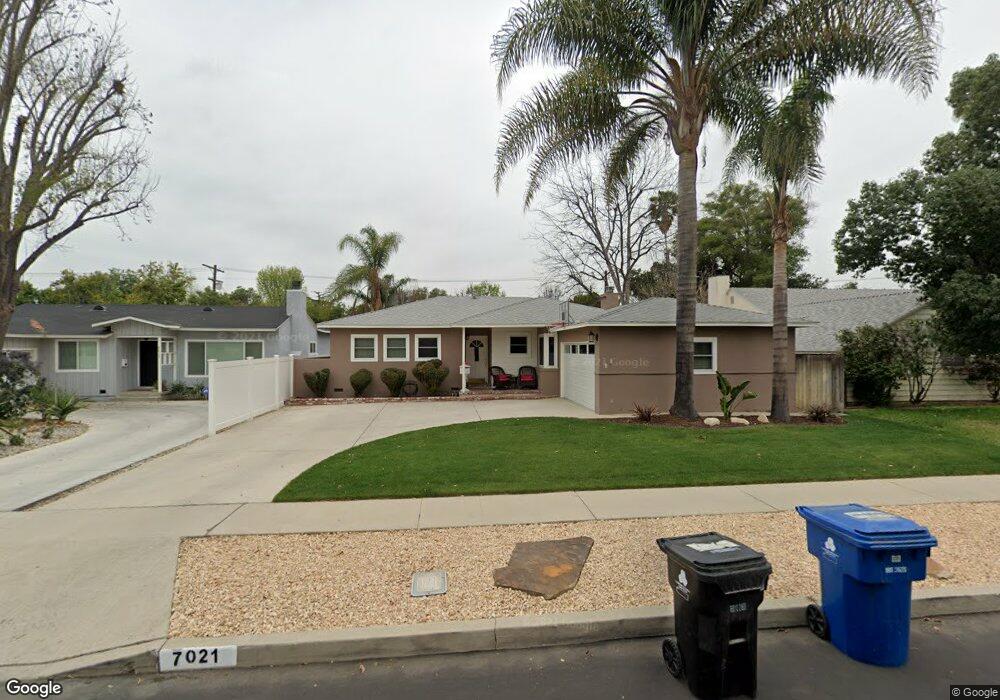
7021 Andasol Ave van Nuys, CA 91406
Estimated Value: $852,891 - $1,267,000
3
Beds
2
Baths
1,184
Sq Ft
$852/Sq Ft
Est. Value
About This Home
This home is located at 7021 Andasol Ave, van Nuys, CA 91406 and is currently estimated at $1,008,973, approximately $852 per square foot. 7021 Andasol Ave is a home located in Los Angeles County with nearby schools including Anatola Avenue Elementary School, William Mulholland Middle, and Magnolia Science Academy 2.
Ownership History
Date
Name
Owned For
Owner Type
Purchase Details
Closed on
May 17, 2002
Sold by
Tapia Jaime
Bought by
Alvarez Alvaro and Alvarez Jennifer
Current Estimated Value
Home Financials for this Owner
Home Financials are based on the most recent Mortgage that was taken out on this home.
Original Mortgage
$241,062
Outstanding Balance
$100,429
Interest Rate
6.74%
Mortgage Type
FHA
Estimated Equity
$908,544
Purchase Details
Closed on
Nov 26, 1996
Sold by
Jones Jophe H
Bought by
Tapia Jaime
Home Financials for this Owner
Home Financials are based on the most recent Mortgage that was taken out on this home.
Original Mortgage
$151,393
Interest Rate
7.76%
Mortgage Type
FHA
Purchase Details
Closed on
Nov 1, 1995
Sold by
Gaddis John William
Bought by
Jones Jophe Hacker
Home Financials for this Owner
Home Financials are based on the most recent Mortgage that was taken out on this home.
Original Mortgage
$98,000
Interest Rate
7.58%
Create a Home Valuation Report for This Property
The Home Valuation Report is an in-depth analysis detailing your home's value as well as a comparison with similar homes in the area
Home Values in the Area
Average Home Value in this Area
Purchase History
| Date | Buyer | Sale Price | Title Company |
|---|---|---|---|
| Alvarez Alvaro | $251,000 | Southland Title Corporation | |
| Tapia Jaime | $154,500 | Progressive Title Co | |
| Jones Jophe Hacker | -- | Continental Lawyers Title Co |
Source: Public Records
Mortgage History
| Date | Status | Borrower | Loan Amount |
|---|---|---|---|
| Open | Alvarez Alvaro | $241,062 | |
| Previous Owner | Tapia Jaime | $151,393 | |
| Previous Owner | Jones Jophe Hacker | $98,000 |
Source: Public Records
Tax History Compared to Growth
Tax History
| Year | Tax Paid | Tax Assessment Tax Assessment Total Assessment is a certain percentage of the fair market value that is determined by local assessors to be the total taxable value of land and additions on the property. | Land | Improvement |
|---|---|---|---|---|
| 2025 | $4,623 | $370,781 | $278,016 | $92,765 |
| 2024 | $4,623 | $363,512 | $272,565 | $90,947 |
| 2023 | $4,537 | $356,385 | $267,221 | $89,164 |
| 2022 | $4,331 | $349,398 | $261,982 | $87,416 |
| 2021 | $4,275 | $342,548 | $256,846 | $85,702 |
| 2019 | $4,150 | $332,390 | $249,229 | $83,161 |
| 2018 | $4,050 | $325,874 | $244,343 | $81,531 |
| 2016 | $3,864 | $313,221 | $234,855 | $78,366 |
| 2015 | $3,808 | $308,517 | $231,328 | $77,189 |
| 2014 | $3,828 | $302,474 | $226,797 | $75,677 |
Source: Public Records
Map
Nearby Homes
- 6914 Andasol Ave
- 7018 Aldea Ave
- 17349 Hartland St
- 17400 Cantlay St
- 6912 Louise Ave
- 6845 Louise Ave
- 7237 Anatola Ave
- 17405 Wyandotte St
- 6820 Jellico Ave
- 6939 White Oak Ave
- 7337 Caldus Ave
- 17048 Sherman Way
- 17064 Cantlay St
- 17406 Valerio St
- 6906 Balcom Ave
- 17443 Valerio St
- 17650 Welby Way
- 17402 Cohasset St
- 16931 Gault St
- 7247 Genesta Ave
- 7013 Andasol Ave
- 7027 Andasol Ave
- 7007 Andasol Ave
- 7033 Andasol Ave
- 7024 Andasol Ave
- 7020 Bianca Ave
- 7014 Bianca Ave
- 7028 Bianca Ave
- 7008 Bianca Ave
- 7001 Andasol Ave
- 7039 Andasol Ave
- 7020 Andasol Ave
- 7034 Bianca Ave
- 7026 Andasol Ave
- 7012 Andasol Ave
- 7000 Bianca Ave
- 7006 Andasol Ave
- 7032 Andasol Ave
- 7045 Andasol Ave
- 7040 Bianca Ave