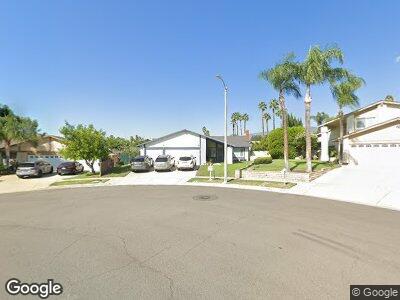
7028 Elmhurst Ave Rancho Cucamonga, CA 91701
Estimated Value: $712,087 - $774,000
3
Beds
2
Baths
1,357
Sq Ft
$553/Sq Ft
Est. Value
About This Home
This home is located at 7028 Elmhurst Ave, Rancho Cucamonga, CA 91701 and is currently estimated at $750,522, approximately $553 per square foot. 7028 Elmhurst Ave is a home located in San Bernardino County with nearby schools including Deer Canyon Elementary, Vineyard Junior High, and Los Osos High.
Ownership History
Date
Name
Owned For
Owner Type
Purchase Details
Closed on
Mar 20, 1998
Sold by
Hwang Yvette
Bought by
Chang Chung Kuei and Hwang Yvette
Current Estimated Value
Home Financials for this Owner
Home Financials are based on the most recent Mortgage that was taken out on this home.
Original Mortgage
$120,500
Interest Rate
7.07%
Purchase Details
Closed on
Jul 4, 1997
Sold by
Chang Chung K and Hwang Yvette
Bought by
Hwang Yvette F
Purchase Details
Closed on
Jun 19, 1995
Sold by
Federal Home Loan Mortgage Corporation
Bought by
Chang Chung Kuei and Hwang Yvette
Home Financials for this Owner
Home Financials are based on the most recent Mortgage that was taken out on this home.
Original Mortgage
$97,000
Interest Rate
8.37%
Purchase Details
Closed on
Nov 9, 1994
Sold by
Fuentes Richard S and Fuentes Juliet
Bought by
Federal Home Loan Mortgage Corporation
Create a Home Valuation Report for This Property
The Home Valuation Report is an in-depth analysis detailing your home's value as well as a comparison with similar homes in the area
Home Values in the Area
Average Home Value in this Area
Purchase History
| Date | Buyer | Sale Price | Title Company |
|---|---|---|---|
| Chang Chung Kuei | -- | -- | |
| Hwang Yvette F | -- | -- | |
| Chang Chung Kuei | $137,000 | First American Title Ins Co | |
| Federal Home Loan Mortgage Corporation | $140,000 | Stewart Title |
Source: Public Records
Mortgage History
| Date | Status | Borrower | Loan Amount |
|---|---|---|---|
| Open | Chang Chung Kuei | $200,000 | |
| Closed | Chang Chung Kuei | $173,000 | |
| Closed | Chang Chung Kuei | $10,780 | |
| Closed | Chang Chung Kuei | $192,000 | |
| Closed | Chang Chung Kuei | $70,000 | |
| Closed | Chang Chung Kuei | $118,500 | |
| Closed | Chang Chung Kuei | $120,500 | |
| Previous Owner | Chang Chung Kuei | $97,000 |
Source: Public Records
Tax History Compared to Growth
Tax History
| Year | Tax Paid | Tax Assessment Tax Assessment Total Assessment is a certain percentage of the fair market value that is determined by local assessors to be the total taxable value of land and additions on the property. | Land | Improvement |
|---|---|---|---|---|
| 2024 | $2,522 | $225,604 | $55,988 | $169,616 |
| 2023 | $2,466 | $221,180 | $54,890 | $166,290 |
| 2022 | $2,459 | $216,843 | $53,814 | $163,029 |
| 2021 | $2,458 | $212,591 | $52,759 | $159,832 |
| 2020 | $2,358 | $210,411 | $52,218 | $158,193 |
| 2019 | $2,385 | $206,285 | $51,194 | $155,091 |
| 2018 | $2,332 | $202,240 | $50,190 | $152,050 |
| 2017 | $2,227 | $198,275 | $49,206 | $149,069 |
| 2016 | $2,167 | $194,387 | $48,241 | $146,146 |
| 2015 | $2,153 | $191,467 | $47,516 | $143,951 |
| 2014 | $2,093 | $187,716 | $46,585 | $141,131 |
Source: Public Records
Map
Nearby Homes
- 7017 Filkins Ave
- 9914 Albany Ave
- 10040 Jonquil Dr
- 10210 Baseline Rd Unit 42
- 10210 Baseline Rd Unit 109
- 10210 Baseline Rd Unit 115
- 10080 Base Line Rd
- 10210 Base Line Rd Unit 141
- 10210 Base Line Rd
- 6949 Laguna Place Unit B1
- 9800 Baseline Rd Unit 144
- 9800 Baseline Rd Unit 101
- 9800 Baseline Rd Unit 87
- 6923 Laguna Place Unit C
- 10350 Baseline Rd Unit 173
- 10350 Baseline Rd Unit 133
- 6958 Doheny Place Unit C
- 7320 Ramona Ave
- 6946 Archibald Ave
- 10133 Shinon Dr
- 7028 Elmhurst Ave
- 10074 Cielito St
- 7038 Elmhurst Ave
- 7031 Cambridge Ave
- 7025 Cambridge Ave
- 7041 Cambridge Ave
- 10061 Monte Vista St
- 10084 Cielito St
- 10049 Monte Vista St
- 10071 Monte Vista St
- 10066 La Vine St
- 10054 La Vine St
- 10085 Cielito St
- 7023 Cambridge Ave
- 10039 Monte Vista St
- 10044 La Vine St
- 10083 Monte Vista St
- 10094 Cielito St
- 10027 Monte Vista St
- 10095 Cielito St