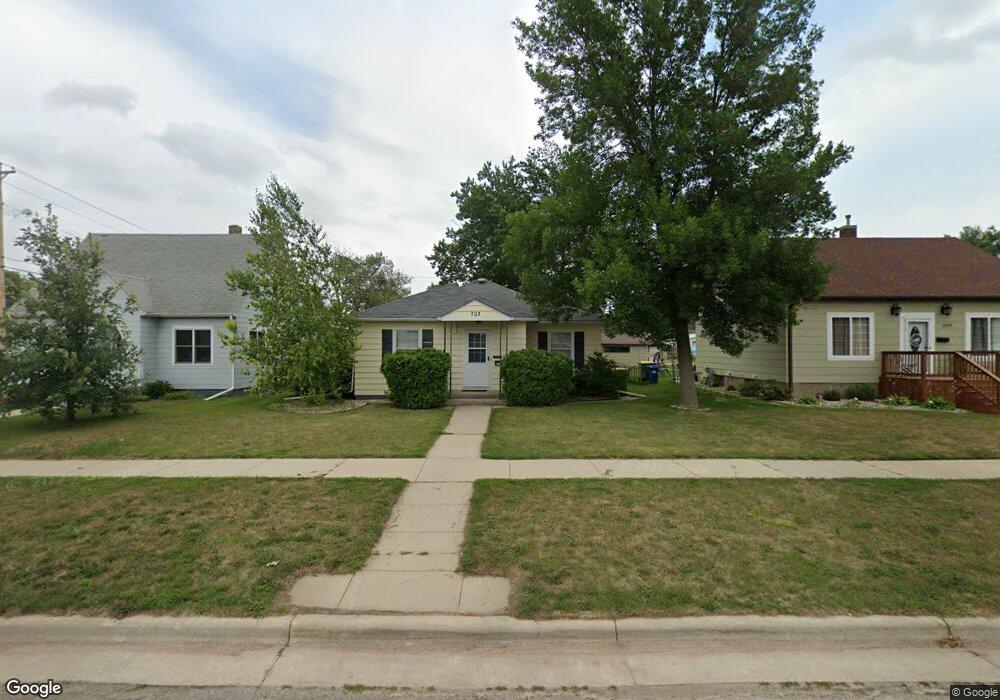
703 4th Ave SW Pipestone, MN 56164
Estimated Value: $148,000 - $205,000
2
Beds
2
Baths
2,677
Sq Ft
$63/Sq Ft
Est. Value
About This Home
This home is located at 703 4th Ave SW, Pipestone, MN 56164 and is currently estimated at $168,941, approximately $63 per square foot. 703 4th Ave SW is a home located in Pipestone County with nearby schools including Brown Elementary School, Pipestone Elementary School, and Heartland Elementary School.
Ownership History
Date
Name
Owned For
Owner Type
Purchase Details
Closed on
Oct 24, 2019
Sold by
Solma Michael M
Bought by
Eck Cody J Van
Current Estimated Value
Home Financials for this Owner
Home Financials are based on the most recent Mortgage that was taken out on this home.
Original Mortgage
$103,615
Outstanding Balance
$90,957
Interest Rate
3.6%
Mortgage Type
New Conventional
Estimated Equity
$77,984
Purchase Details
Closed on
Jul 30, 2010
Sold by
Solma Michael M and Solma Cathy
Bought by
Solma Michael M and Solma Cathy
Purchase Details
Closed on
Mar 11, 2005
Sold by
Priester Donald W and Priester Iva K
Bought by
Solma Michael M
Home Financials for this Owner
Home Financials are based on the most recent Mortgage that was taken out on this home.
Original Mortgage
$69,000
Interest Rate
8.25%
Create a Home Valuation Report for This Property
The Home Valuation Report is an in-depth analysis detailing your home's value as well as a comparison with similar homes in the area
Home Values in the Area
Average Home Value in this Area
Purchase History
| Date | Buyer | Sale Price | Title Company |
|---|---|---|---|
| Eck Cody J Van | $121,900 | Pipestone Abstract & Title C | |
| Solma Michael M | -- | -- | |
| Solma Michael M | -- | -- |
Source: Public Records
Mortgage History
| Date | Status | Borrower | Loan Amount |
|---|---|---|---|
| Open | Eck Cody J Van | $103,615 | |
| Previous Owner | Solma Michael M | $69,000 |
Source: Public Records
Tax History Compared to Growth
Tax History
| Year | Tax Paid | Tax Assessment Tax Assessment Total Assessment is a certain percentage of the fair market value that is determined by local assessors to be the total taxable value of land and additions on the property. | Land | Improvement |
|---|---|---|---|---|
| 2025 | $2,068 | $148,800 | $13,500 | $135,300 |
| 2024 | $2,068 | $149,000 | $13,500 | $135,500 |
| 2023 | $1,456 | $140,800 | $13,500 | $127,300 |
| 2022 | $1,244 | $114,600 | $11,300 | $103,300 |
| 2021 | $1,264 | $98,400 | $11,300 | $87,100 |
| 2020 | $1,134 | $98,500 | $11,300 | $87,200 |
| 2019 | $1,264 | $90,700 | $11,300 | $79,400 |
| 2018 | $1,126 | $86,300 | $11,300 | $75,000 |
| 2017 | $938 | $80,100 | $11,300 | $68,800 |
| 2016 | $858 | $0 | $0 | $0 |
| 2015 | $854 | $46,400 | $5,324 | $41,076 |
| 2014 | $854 | $43,400 | $2,398 | $41,002 |
Source: Public Records
Map
Nearby Homes
- 743 6th Ave SW
- 617 S Hiawatha Ave
- 919 3rd Ave SW
- 718 7th St SW
- 901 7th Ave SW
- 903 7th Ave SW
- 219 3rd Ave SW
- 504 3rd Ave SE
- 821 7th St SW
- 150 Ridgeview Dr
- 913 9th Ave SW
- 1102 9th Ave SW
- 907 9th Ave SW
- 215 8th Ave SW
- 202 7th Ave SW
- 1120 8th Ave SW
- 510 5th St SE
- 418 14th St SW
- 504 4th St SE
- 804 6th Ave SE