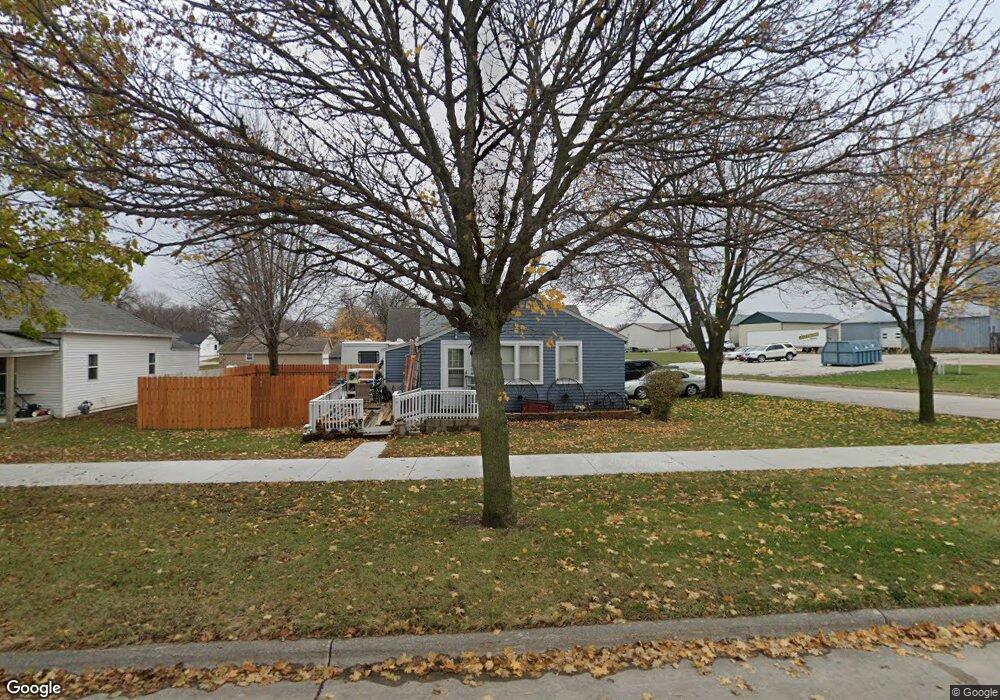
703 5th St Lake View, IA 51450
Estimated Value: $80,000 - $119,000
--
Bed
--
Bath
716
Sq Ft
$145/Sq Ft
Est. Value
About This Home
This home is located at 703 5th St, Lake View, IA 51450 and is currently estimated at $103,982, approximately $145 per square foot. 703 5th St is a home located in Sac County with nearby schools including East Sac County High School.
Ownership History
Date
Name
Owned For
Owner Type
Purchase Details
Closed on
Apr 16, 2024
Sold by
Barnes James E and Olerich Jeanne M
Bought by
Huffman Dean
Current Estimated Value
Purchase Details
Closed on
Jun 25, 2009
Sold by
Haley M Thomas and Haley Patricia
Bought by
Schwanz Chad and Schwanz Cristina M
Home Financials for this Owner
Home Financials are based on the most recent Mortgage that was taken out on this home.
Original Mortgage
$49,000
Interest Rate
5.75%
Mortgage Type
FHA
Purchase Details
Closed on
Apr 11, 2007
Sold by
Swanson Milton M and Swanson Cristina M
Bought by
Schwanz Chad A and Schwanz Cristina M
Home Financials for this Owner
Home Financials are based on the most recent Mortgage that was taken out on this home.
Original Mortgage
$29,000
Interest Rate
6.5%
Mortgage Type
Purchase Money Mortgage
Purchase Details
Closed on
Jul 30, 2005
Sold by
Adams Robert and Adams Marva
Bought by
Swanson Milton M and Swanson Melissa M
Create a Home Valuation Report for This Property
The Home Valuation Report is an in-depth analysis detailing your home's value as well as a comparison with similar homes in the area
Home Values in the Area
Average Home Value in this Area
Purchase History
| Date | Buyer | Sale Price | Title Company |
|---|---|---|---|
| Huffman Dean | -- | None Listed On Document | |
| Schwanz Chad | $59,500 | None Available | |
| Schwanz Chad A | $32,500 | None Available | |
| Swanson Milton M | $36,000 | None Available |
Source: Public Records
Mortgage History
| Date | Status | Borrower | Loan Amount |
|---|---|---|---|
| Previous Owner | Schwanz Chad | $49,000 | |
| Previous Owner | Schwanz Chad A | $29,000 |
Source: Public Records
Tax History Compared to Growth
Tax History
| Year | Tax Paid | Tax Assessment Tax Assessment Total Assessment is a certain percentage of the fair market value that is determined by local assessors to be the total taxable value of land and additions on the property. | Land | Improvement |
|---|---|---|---|---|
| 2025 | $778 | $89,730 | $2,460 | $87,270 |
| 2024 | $778 | $75,980 | $2,220 | $73,760 |
| 2023 | $826 | $75,980 | $2,220 | $73,760 |
| 2022 | $800 | $55,820 | $2,220 | $53,600 |
| 2021 | $800 | $55,820 | $2,220 | $53,600 |
| 2020 | $640 | $43,660 | $2,220 | $41,440 |
| 2019 | $586 | $43,660 | $2,220 | $41,440 |
| 2018 | $586 | $39,190 | $0 | $0 |
| 2017 | $586 | $35,840 | $0 | $0 |
| 2016 | $544 | $35,840 | $0 | $0 |
| 2015 | $544 | $34,570 | $0 | $0 |
| 2014 | $526 | $34,570 | $0 | $0 |
Source: Public Records
Map
Nearby Homes