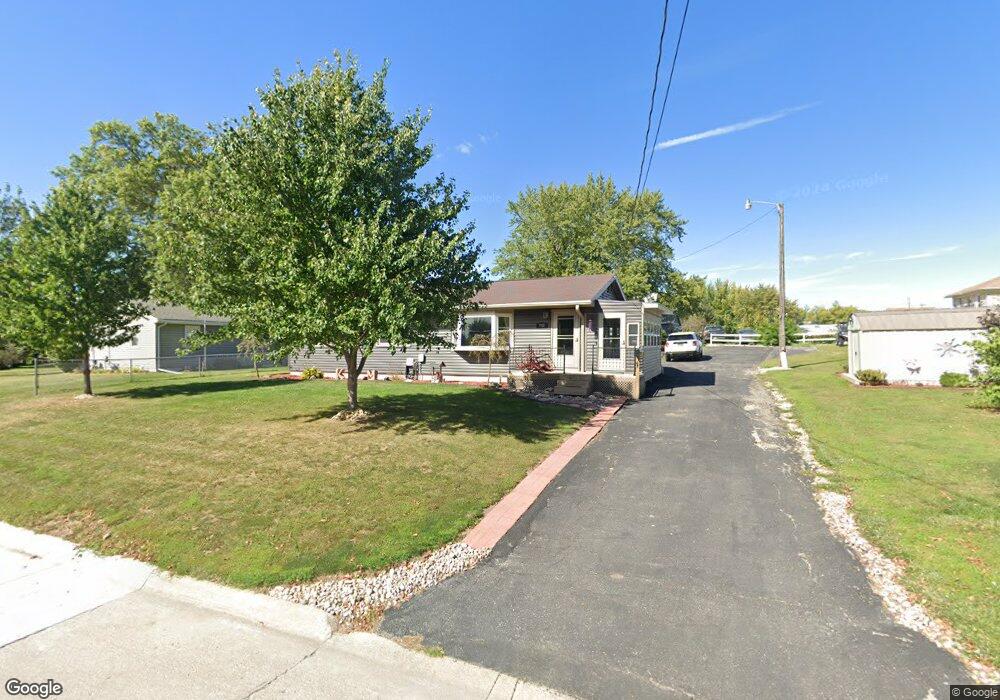
703 E 9th St Vinton, IA 52349
Estimated Value: $205,581 - $227,000
3
Beds
2
Baths
1,104
Sq Ft
$192/Sq Ft
Est. Value
About This Home
This home is located at 703 E 9th St, Vinton, IA 52349 and is currently estimated at $212,395, approximately $192 per square foot. 703 E 9th St is a home located in Benton County with nearby schools including Tilford Elementary School, Vinton-Shellsburg Middle School, and Vinton-Shellsburg High School.
Ownership History
Date
Name
Owned For
Owner Type
Purchase Details
Closed on
Apr 26, 2007
Sold by
Mann Judith K
Bought by
Dufresne Kevin D and Dufresne Micki J
Current Estimated Value
Home Financials for this Owner
Home Financials are based on the most recent Mortgage that was taken out on this home.
Original Mortgage
$126,760
Outstanding Balance
$76,853
Interest Rate
6.2%
Mortgage Type
FHA
Estimated Equity
$135,542
Purchase Details
Closed on
Apr 25, 2007
Sold by
Mann Ralph Charles
Bought by
Mann Judith K
Home Financials for this Owner
Home Financials are based on the most recent Mortgage that was taken out on this home.
Original Mortgage
$126,760
Outstanding Balance
$76,853
Interest Rate
6.2%
Mortgage Type
FHA
Estimated Equity
$135,542
Create a Home Valuation Report for This Property
The Home Valuation Report is an in-depth analysis detailing your home's value as well as a comparison with similar homes in the area
Home Values in the Area
Average Home Value in this Area
Purchase History
| Date | Buyer | Sale Price | Title Company |
|---|---|---|---|
| Dufresne Kevin D | $129,000 | None Available | |
| Mann Judith K | -- | None Available |
Source: Public Records
Mortgage History
| Date | Status | Borrower | Loan Amount |
|---|---|---|---|
| Open | Dufresne Kevin D | $126,760 |
Source: Public Records
Tax History
| Year | Tax Paid | Tax Assessment Tax Assessment Total Assessment is a certain percentage of the fair market value that is determined by local assessors to be the total taxable value of land and additions on the property. | Land | Improvement |
|---|---|---|---|---|
| 2025 | $3,208 | $202,000 | $24,400 | $177,600 |
| 2024 | $3,208 | $181,400 | $23,400 | $158,000 |
| 2023 | $2,990 | $181,400 | $23,400 | $158,000 |
| 2022 | $3,066 | $147,800 | $18,700 | $129,100 |
| 2021 | $3,066 | $147,800 | $18,700 | $129,100 |
| 2020 | $2,470 | $122,900 | $17,800 | $105,100 |
| 2019 | $2,490 | $122,900 | $17,800 | $105,100 |
| 2018 | $2,414 | $122,100 | $16,700 | $105,400 |
| 2017 | $2,284 | $122,100 | $16,700 | $105,400 |
| 2016 | $2,242 | $112,600 | $15,600 | $97,000 |
| 2015 | $2,242 | $112,600 | $15,600 | $97,000 |
| 2014 | $2,256 | $113,000 | $0 | $0 |
Source: Public Records
Map
Nearby Homes
Your Personal Tour Guide
Ask me questions while you tour the home.