Estimated Value: $419,165 - $433,000
3
Beds
3
Baths
2,156
Sq Ft
$197/Sq Ft
Est. Value
About This Home
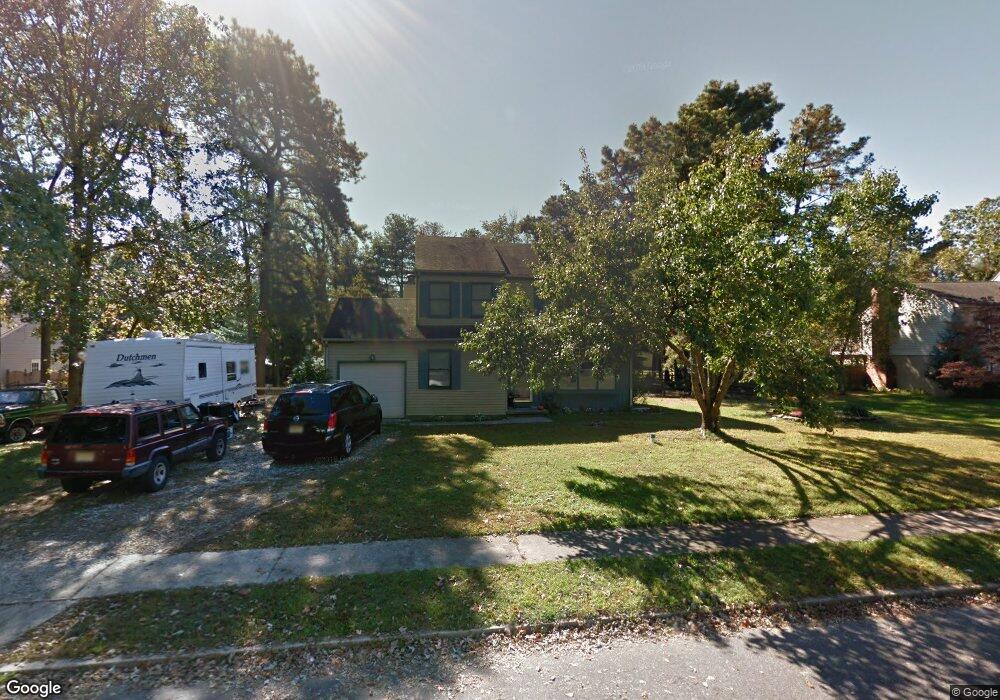
This home is located at 703 Forrest Dr, Atco, NJ 08004 and is currently estimated at $425,791, approximately $197 per square foot. 703 Forrest Dr is a home located in Camden County with nearby schools including Thomas Richards Elementary School, Waterford Elementary School, and Atco Elementary School.
Ownership History
Date
Name
Owned For
Owner Type
Purchase Details
Closed on
Oct 28, 2011
Sold by
Delvecchio Phillip L and Del Vecchio Bonnie L
Bought by
Campbell Francis H and Campbell Kristen L
Current Estimated Value
Home Financials for this Owner
Home Financials are based on the most recent Mortgage that was taken out on this home.
Original Mortgage
$140,000
Outstanding Balance
$79,421
Interest Rate
3.92%
Mortgage Type
Purchase Money Mortgage
Estimated Equity
$346,370
Create a Home Valuation Report for This Property
The Home Valuation Report is an in-depth analysis detailing your home's value as well as a comparison with similar homes in the area
Home Values in the Area
Average Home Value in this Area
Purchase History
| Date | Buyer | Sale Price | Title Company |
|---|---|---|---|
| Campbell Francis H | $100,000 | -- |
Source: Public Records
Mortgage History
| Date | Status | Borrower | Loan Amount |
|---|---|---|---|
| Open | Campbell Francis H | $140,000 |
Source: Public Records
Tax History
| Year | Tax Paid | Tax Assessment Tax Assessment Total Assessment is a certain percentage of the fair market value that is determined by local assessors to be the total taxable value of land and additions on the property. | Land | Improvement |
|---|---|---|---|---|
| 2025 | $8,358 | $189,700 | $43,200 | $146,500 |
| 2024 | $8,151 | $189,700 | $43,200 | $146,500 |
Source: Public Records
Map
Nearby Homes
- 2422 Louden Ln
- 2408 Louden Ln
- 2470 Medford Rd
- 687 Jackson Rd
- 622 Jackson Rd
- 2336 Auburn Ave
- 2371 Bellevue Ave
- 2311 Gennessee Ave
- 402 Holly Dr
- 2216 Harrison Ave
- 2172 Atco Ave
- 344 Raritan Ave
- 2157 Almira Ave
- 2307 Cooper Rd
- 2317 Cooper Rd
- 10 Peter Hurd Way
- 2006 A Ave
- 965 Martha Blvd
- 2107 Cooper Rd
- 2212 Oakwood Ln
Your Personal Tour Guide
Ask me questions while you tour the home.