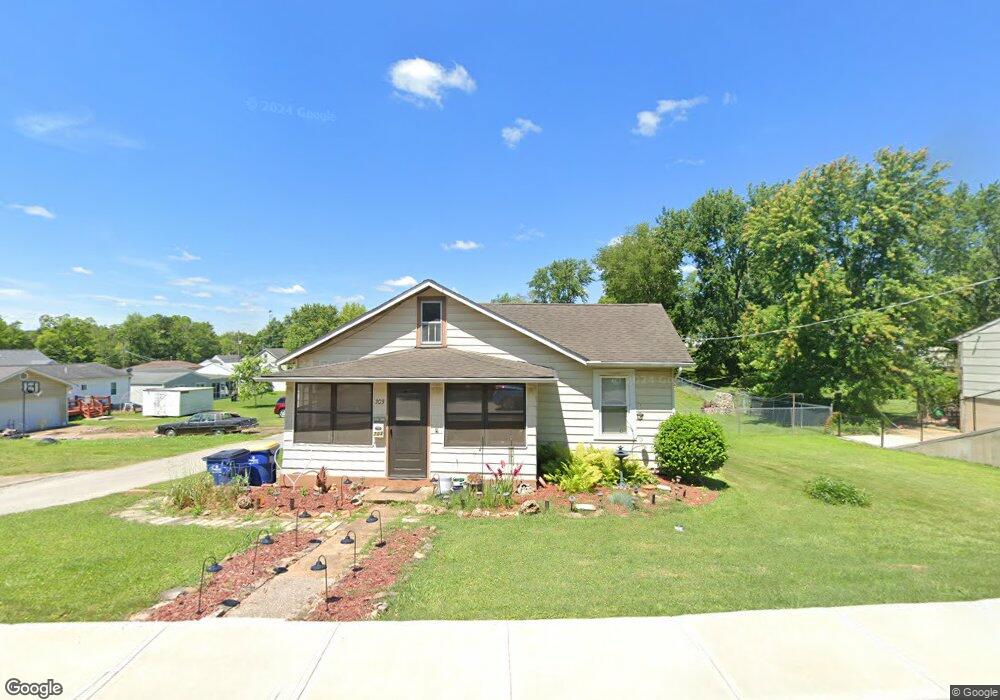
703 Joachim St Festus, MO 63028
Festus/Crystal City NeighborhoodEstimated Value: $171,091 - $205,000
Studio
--
Bath
1,216
Sq Ft
$154/Sq Ft
Est. Value
About This Home
This home is located at 703 Joachim St, Festus, MO 63028 and is currently estimated at $187,773, approximately $154 per square foot. 703 Joachim St is a home located in Jefferson County with nearby schools including Festus Elementary School, Festus Intermediate School, and Festus Middle School.
Ownership History
Date
Name
Owned For
Owner Type
Purchase Details
Closed on
Mar 25, 2011
Sold by
Derousse Larry J and Derousse Julie A
Bought by
Derousse Julie A and Axtetter Julie A
Current Estimated Value
Purchase Details
Closed on
Jul 9, 1999
Sold by
Becker Benjamin D and Becker Teresa
Bought by
Derousse Larry J and Derousse Julie A
Home Financials for this Owner
Home Financials are based on the most recent Mortgage that was taken out on this home.
Original Mortgage
$73,150
Outstanding Balance
$19,924
Interest Rate
7.21%
Estimated Equity
$167,849
Create a Home Valuation Report for This Property
The Home Valuation Report is an in-depth analysis detailing your home's value as well as a comparison with similar homes in the area
Home Values in the Area
Average Home Value in this Area
Purchase History
| Date | Buyer | Sale Price | Title Company |
|---|---|---|---|
| Derousse Julie A | -- | None Available | |
| Derousse Larry J | -- | First American Title |
Source: Public Records
Mortgage History
| Date | Status | Borrower | Loan Amount |
|---|---|---|---|
| Open | Derousse Larry J | $73,150 |
Source: Public Records
Tax History
| Year | Tax Paid | Tax Assessment Tax Assessment Total Assessment is a certain percentage of the fair market value that is determined by local assessors to be the total taxable value of land and additions on the property. | Land | Improvement |
|---|---|---|---|---|
| 2025 | $742 | $14,000 | $1,500 | $12,500 |
| 2024 | $742 | $13,100 | $1,500 | $11,600 |
| 2023 | $742 | $13,100 | $1,500 | $11,600 |
| 2022 | $738 | $13,100 | $1,500 | $11,600 |
| 2021 | $738 | $13,100 | $1,500 | $11,600 |
| 2020 | $733 | $12,200 | $1,200 | $11,000 |
| 2019 | $733 | $12,200 | $1,200 | $11,000 |
| 2018 | $661 | $12,200 | $1,200 | $11,000 |
| 2017 | $661 | $12,200 | $1,200 | $11,000 |
| 2016 | $583 | $10,700 | $1,400 | $9,300 |
Source: Public Records
Map
Nearby Homes
- 617 N 6th St
- 416 Russell Ave
- 716 N Mill St
- 601 Warne St
- 609 Valentine St
- 806 Virginia Ave
- 912 Parc Central Dr
- 1001 Parc Central Dr
- 129 N 9th St
- 1113 Huber St
- 212 N Adams St
- 823 Delmar Ave
- 810 S 2nd St
- 1016 Ann St
- 410 S 4th St
- 947 S 2nd St
- 409 S 5th St
- 1018 Savanna Place Dr
- 955 S 3rd St
- 403 S Adams St
Your Personal Tour Guide
Ask me questions while you tour the home.