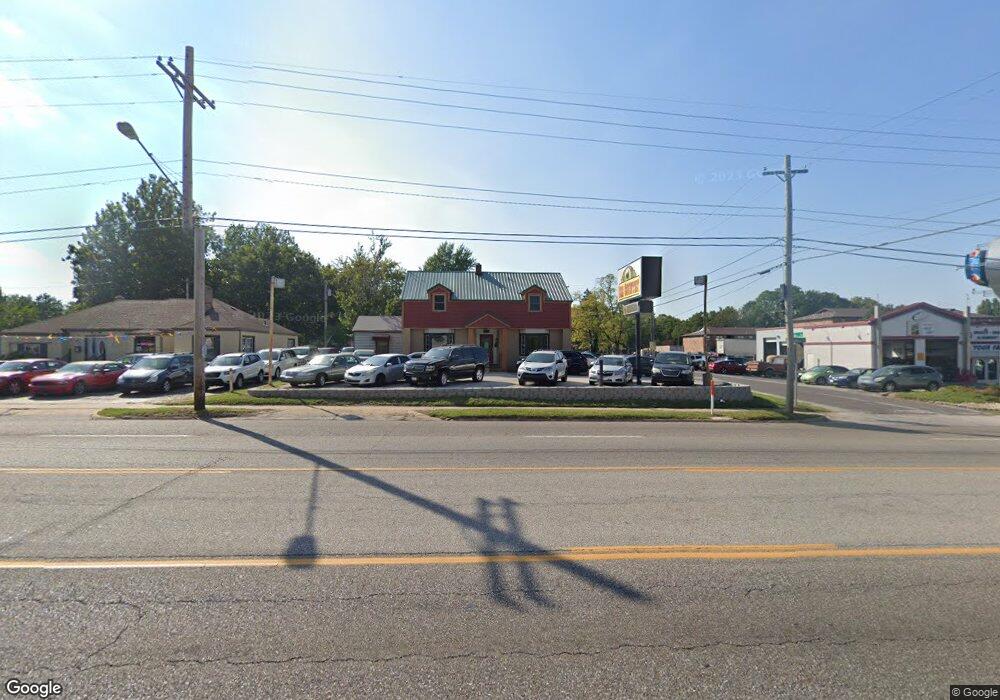
703 S Glenstone Ave Unit 8 & 9 Springfield, MO 65802
Bingham NeighborhoodEstimated Value: $343,360
--
Bed
--
Bath
6,000
Sq Ft
$57/Sq Ft
Est. Value
About This Home
This home is located at 703 S Glenstone Ave Unit 8 & 9, Springfield, MO 65802 and is currently priced at $343,360, approximately $57 per square foot. 703 S Glenstone Ave Unit 8 & 9 is a home located in Greene County with nearby schools including Rountree Elementary School, Jarrett Middle, and Parkview High School.
Ownership History
Date
Name
Owned For
Owner Type
Purchase Details
Closed on
Dec 6, 2011
Sold by
Herman Clarence and Malmquist Patricia Ann
Bought by
Ccw Llc
Current Estimated Value
Home Financials for this Owner
Home Financials are based on the most recent Mortgage that was taken out on this home.
Original Mortgage
$223,000
Interest Rate
4.14%
Mortgage Type
Commercial
Purchase Details
Closed on
Nov 30, 2010
Sold by
Midwest Real Estate Investments Llc
Bought by
Herman Clarence
Home Financials for this Owner
Home Financials are based on the most recent Mortgage that was taken out on this home.
Original Mortgage
$120,000
Interest Rate
4.23%
Mortgage Type
FHA
Purchase Details
Closed on
Mar 16, 2010
Sold by
Valene Barbara J
Bought by
Midwest Real Estate Investments Llc
Purchase Details
Closed on
Jun 9, 2009
Sold by
Payne Caly H
Bought by
Valene Barbara J
Create a Home Valuation Report for This Property
The Home Valuation Report is an in-depth analysis detailing your home's value as well as a comparison with similar homes in the area
Home Values in the Area
Average Home Value in this Area
Purchase History
| Date | Buyer | Sale Price | Title Company |
|---|---|---|---|
| Ccw Llc | -- | Fidelity Title Agency | |
| Herman Clarence | -- | None Available | |
| Midwest Real Estate Investments Llc | -- | None Available | |
| Valene Barbara J | -- | None Available |
Source: Public Records
Mortgage History
| Date | Status | Borrower | Loan Amount |
|---|---|---|---|
| Closed | Ccw Llc | $223,000 | |
| Previous Owner | Herman Clarence | $120,000 |
Source: Public Records
Tax History Compared to Growth
Tax History
| Year | Tax Paid | Tax Assessment Tax Assessment Total Assessment is a certain percentage of the fair market value that is determined by local assessors to be the total taxable value of land and additions on the property. | Land | Improvement |
|---|---|---|---|---|
| 2025 | $3,235 | $58,750 | $34,940 | $23,810 |
| 2024 | $3,235 | $50,500 | $31,360 | $19,140 |
| 2023 | $3,219 | $50,500 | $31,360 | $19,140 |
| 2022 | $3,283 | $50,500 | $31,360 | $19,140 |
| 2021 | $3,283 | $50,500 | $31,360 | $19,140 |
| 2020 | $3,417 | $50,620 | $31,360 | $19,260 |
| 2019 | $3,336 | $50,620 | $31,360 | $19,260 |
| 2018 | $3,194 | $48,480 | $31,360 | $17,120 |
| 2017 | $3,166 | $48,030 | $31,360 | $16,670 |
| 2016 | $3,132 | $48,030 | $31,360 | $16,670 |
| 2015 | $3,108 | $48,030 | $31,360 | $16,670 |
| 2014 | $3,087 | $47,420 | $31,360 | $16,060 |
Source: Public Records
Map
Nearby Homes
- 1938 E Monroe Terrace
- 613 S Wildan Ave
- 1523 E Monroe St
- 1673 E Walnut St
- 606 S Grandview Ave
- 1700 E Cairo St
- 501 S Weller Ave
- 1505 E Walnut St
- 821 S Pickwick Ave
- 338 S Weller Ave
- 1020 S Crutcher Ave
- 1044 S Stewart Ave
- 2141 E Page St
- 1435 E Walnut St
- 716 S Rogers Ave
- 652 S Barnes Ave
- 1352 E Elm St
- 1462 E Mcdaniel St
- 2212 E Cherry St
- 731 S Marlan Ave
- 702 S Kentwood Ave
- 706 S Kentwood Ave
- 712 S Kentwood Ave
- 716 S Kentwood Ave
- 715 S Glenstone Ave
- 720 S Kentwood Ave
- 726 S Kentwood Ave
- 701 S Kentwood Ave
- 673 S Kentwood Ave
- 667 S Kentwood Ave
- 746 S Fairway Ave
- 740 S Fairway Ave
- 663 S Kentwood Ave
- 750 S Fairway Ave
- 658 S Kentwood Ave
- 736 S Fairway Ave
- 730 S Fairway Ave
- 659 S Kentwood Ave
- 1814 E Monroe St
- 1825 E Monroe St