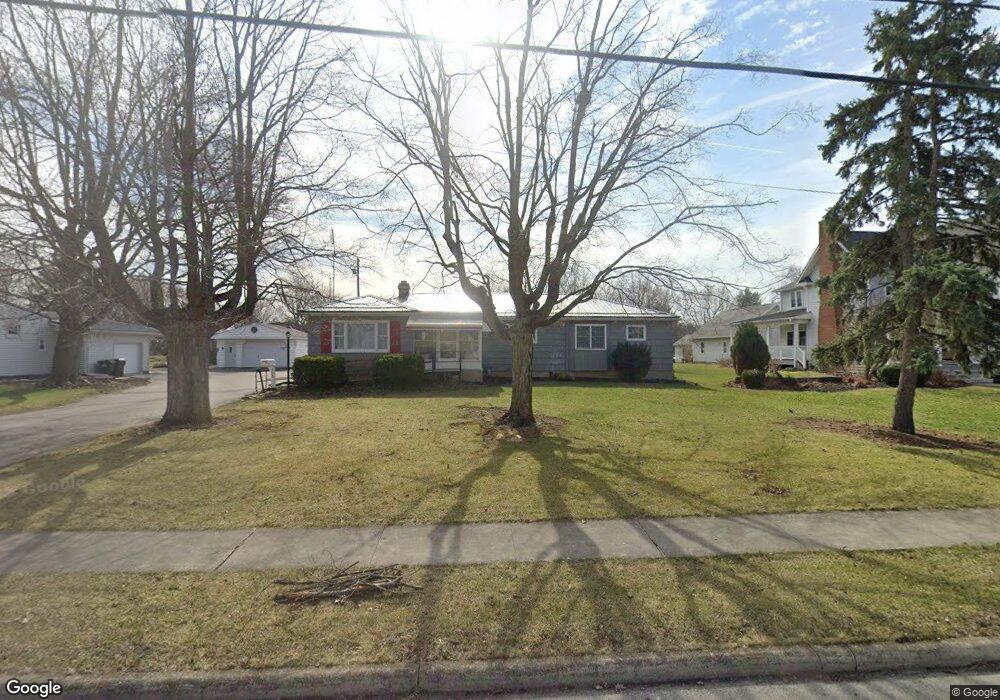
703 S Main St Bluffton, OH 45817
Estimated Value: $226,109 - $249,000
3
Beds
3
Baths
1,596
Sq Ft
$149/Sq Ft
Est. Value
About This Home
This home is located at 703 S Main St, Bluffton, OH 45817 and is currently estimated at $238,027, approximately $149 per square foot. 703 S Main St is a home located in Allen County with nearby schools including Bluffton Elementary School, Bluffton Middle School, and Bluffton High School.
Ownership History
Date
Name
Owned For
Owner Type
Purchase Details
Closed on
Jun 13, 2024
Sold by
Bemiller James L and Bourassa Jacqueline L
Bought by
Halker Kirby Allen and Bourassa Andrea Louise
Current Estimated Value
Purchase Details
Closed on
Aug 2, 2023
Sold by
Mault Mark and Mault Kathie L
Bought by
Bite and Buzz
Purchase Details
Closed on
Jun 1, 2010
Sold by
Barns Lori A
Bought by
Bemiller James L and Bemiller Joan L
Purchase Details
Closed on
Jan 1, 1990
Bought by
Badertscher Don L
Create a Home Valuation Report for This Property
The Home Valuation Report is an in-depth analysis detailing your home's value as well as a comparison with similar homes in the area
Home Values in the Area
Average Home Value in this Area
Purchase History
| Date | Buyer | Sale Price | Title Company |
|---|---|---|---|
| Halker Kirby Allen | $183,000 | None Listed On Document | |
| Bite | $245,000 | None Listed On Document | |
| Bemiller James L | $100,000 | Attorney | |
| Badertscher Don L | -- | -- |
Source: Public Records
Tax History
| Year | Tax Paid | Tax Assessment Tax Assessment Total Assessment is a certain percentage of the fair market value that is determined by local assessors to be the total taxable value of land and additions on the property. | Land | Improvement |
|---|---|---|---|---|
| 2024 | $2,210 | $65,210 | $13,830 | $51,380 |
| 2023 | $1,611 | $54,330 | $11,520 | $42,810 |
| 2022 | $1,642 | $54,330 | $11,520 | $42,810 |
| 2021 | $1,652 | $54,330 | $11,520 | $42,810 |
| 2020 | $1,544 | $47,220 | $11,030 | $36,190 |
| 2019 | $1,544 | $47,220 | $11,030 | $36,190 |
| 2018 | $1,551 | $47,220 | $11,030 | $36,190 |
| 2017 | $1,307 | $41,200 | $11,030 | $30,170 |
| 2016 | $1,320 | $41,200 | $11,030 | $30,170 |
| 2015 | $1,312 | $41,200 | $11,030 | $30,170 |
| 2014 | $1,312 | $40,110 | $10,710 | $29,400 |
| 2013 | $1,213 | $40,110 | $10,710 | $29,400 |
Source: Public Records
Map
Nearby Homes
- 329 Parkview Dr
- 327 Parkview Dr
- 321 Parkview Dr
- 319 Parkview Dr
- 331 Parkview Dr
- 317 Parkview Dr
- 333 Parkview Dr
- 315 Parkview Dr
- 301 Parkview Dr
- 303 Parkview Dr
- 307 Parkview Dr
- 305 Parkview Dr
- 513 S Jackson St
- 0 Columbus Grove-Bluffton Rd
- 307 S Main St Unit back
- 151 S Lawn Ave
- 160 Chestnut Ln
- 408 Cherry St
- 0 Ohio 103
- 222 N Lawn Ave
Your Personal Tour Guide
Ask me questions while you tour the home.