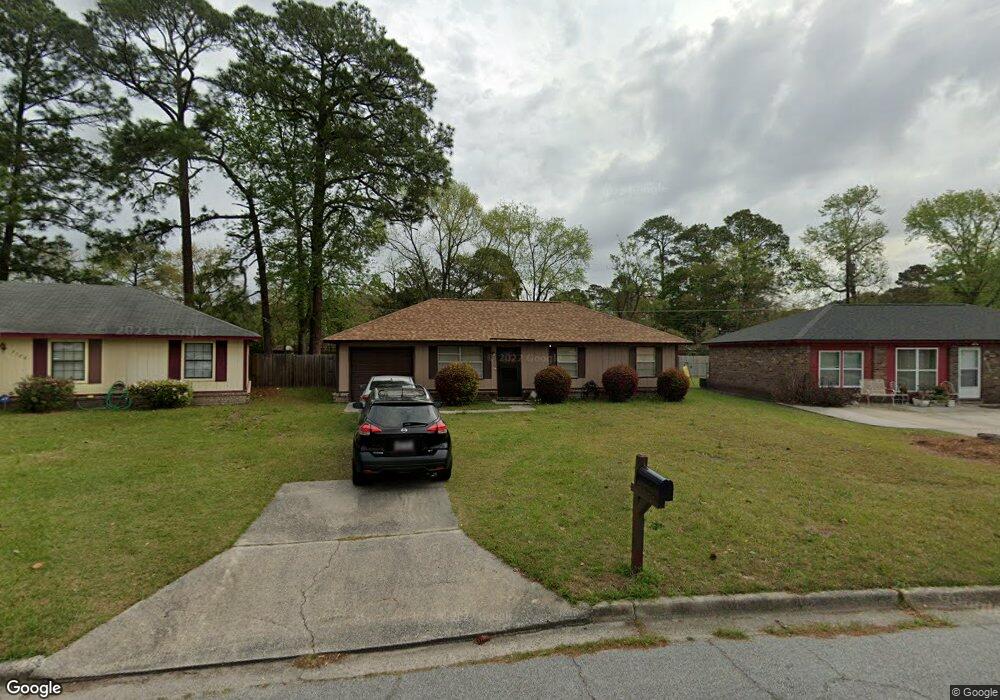
7030 Key St Savannah, GA 31406
Norwood-Wylly Island NeighborhoodEstimated Value: $222,645 - $262,000
3
Beds
2
Baths
1,100
Sq Ft
$218/Sq Ft
Est. Value
About This Home
A lovey home located on the southside of beautiful Savanah, GA. This single family home has 3 bedrooms, 1 and a half baths, living room, large kitchen and dinning room combination, single car garage with washer and dryer hookup, large privacy fenced backyard, central heat and air, with off street parking and much more.
Ownership History
Date
Name
Owned For
Owner Type
Purchase Details
Closed on
Jul 28, 2015
Sold by
Johnson James H
Bought by
Johnson James H and Johnson Debra A
Current Estimated Value
Home Financials for this Owner
Home Financials are based on the most recent Mortgage that was taken out on this home.
Original Mortgage
$53,000
Outstanding Balance
$41,797
Interest Rate
4.11%
Mortgage Type
New Conventional
Estimated Equity
$198,364
Create a Home Valuation Report for This Property
The Home Valuation Report is an in-depth analysis detailing your home's value as well as a comparison with similar homes in the area
Home Values in the Area
Average Home Value in this Area
Purchase History
| Date | Buyer | Sale Price | Title Company |
|---|---|---|---|
| Johnson James H | -- | -- |
Source: Public Records
Mortgage History
| Date | Status | Borrower | Loan Amount |
|---|---|---|---|
| Open | Johnson James H | $53,000 |
Source: Public Records
Property History
| Date | Event | Price | List to Sale | Price per Sq Ft |
|---|---|---|---|---|
| 11/29/2024 11/29/24 | Off Market | $1,475 | -- | -- |
| 11/08/2024 11/08/24 | For Rent | $1,475 | -- | -- |
Tax History Compared to Growth
Tax History
| Year | Tax Paid | Tax Assessment Tax Assessment Total Assessment is a certain percentage of the fair market value that is determined by local assessors to be the total taxable value of land and additions on the property. | Land | Improvement |
|---|---|---|---|---|
| 2025 | $2,544 | $56,520 | $20,000 | $36,520 |
| 2024 | $2,544 | $57,360 | $20,000 | $37,360 |
| 2023 | $1,639 | $45,320 | $12,920 | $32,400 |
| 2022 | $1,355 | $42,200 | $12,920 | $29,280 |
| 2021 | $1,428 | $38,040 | $12,920 | $25,120 |
| 2020 | $1,464 | $37,920 | $12,920 | $25,000 |
| 2019 | $1,384 | $35,600 | $12,920 | $22,680 |
| 2018 | $1,376 | $35,320 | $12,920 | $22,400 |
| 2017 | $1,397 | $35,640 | $12,920 | $22,720 |
| 2016 | $1,087 | $31,360 | $12,920 | $18,440 |
| 2015 | $1,121 | $32,320 | $12,920 | $19,400 |
| 2014 | $1,684 | $33,360 | $0 | $0 |
Source: Public Records
Map
Nearby Homes
- 7014 Key St
- 19 Robin Hood Dr
- 111 S Robinhood Dr
- 7206 Garfield St
- 2511 Little John Ct
- 7216 Garfield St
- 4 Cross Bow Ct
- 6929 Key St
- 117 Hope Ln Unit A
- 19 Arline Dr
- 30 Gerald Dr
- 28 Gerald Dr
- 9 Gerald Dr
- 7308 Garfield St
- 23 Brookview Dr
- 102 Hope Ln Unit B
- 0 Skinner Place
- 0 Skinner Place Unit 10588694
- 20 Lansing Ave Unit C
- 0 Albert St Unit SA337026