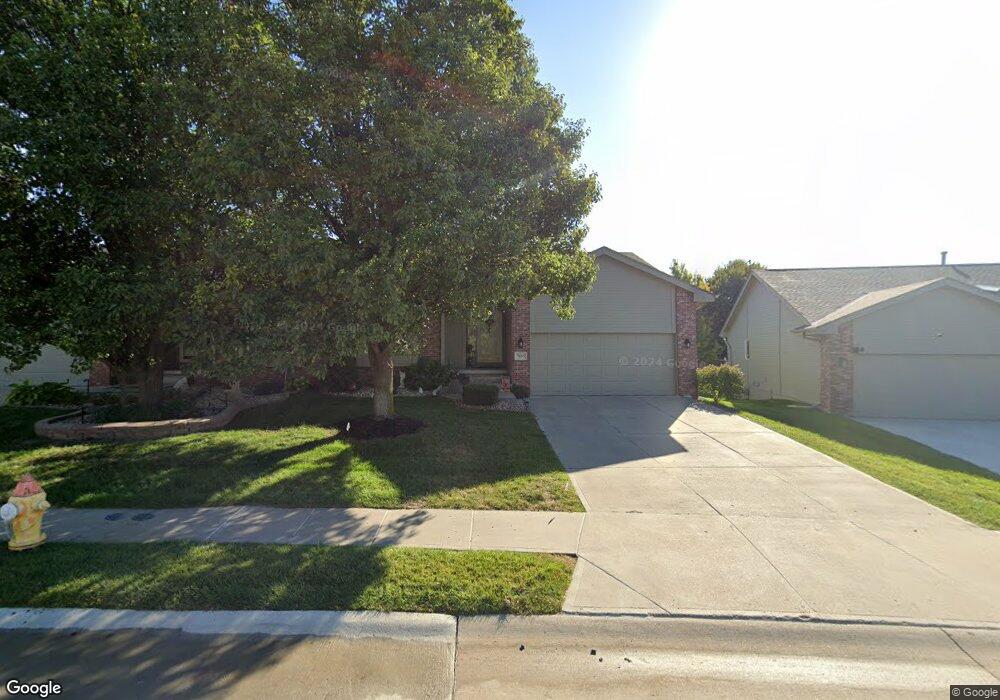
7033 S 163rd St Omaha, NE 68136
Millard Park NeighborhoodEstimated Value: $290,081 - $343,000
2
Beds
5
Baths
1,388
Sq Ft
$226/Sq Ft
Est. Value
About This Home
This home is located at 7033 S 163rd St, Omaha, NE 68136 and is currently estimated at $314,270, approximately $226 per square foot. 7033 S 163rd St is a home located in Sarpy County with nearby schools including Black Elk Elementary School, Beadle Middle School, and Millard West High School.
Ownership History
Date
Name
Owned For
Owner Type
Purchase Details
Closed on
May 8, 2019
Sold by
Stibbs Marie E
Bought by
Stibbs Stibbs Marie E Marie E and Gerald E Stibbs & Marie E Stibbs Joint R
Current Estimated Value
Purchase Details
Closed on
Feb 26, 2004
Sold by
Stibbs Marie E
Bought by
Revocabl Gerald E and Revocabl Marie
Home Financials for this Owner
Home Financials are based on the most recent Mortgage that was taken out on this home.
Original Mortgage
$57,000
Interest Rate
5.67%
Purchase Details
Closed on
Jan 2, 2004
Sold by
Landers Mark A
Bought by
Stibbs Marie E
Home Financials for this Owner
Home Financials are based on the most recent Mortgage that was taken out on this home.
Original Mortgage
$57,000
Interest Rate
5.67%
Purchase Details
Closed on
Oct 18, 2000
Sold by
Dave Paik Builders Inc
Bought by
Landers Mark A
Home Financials for this Owner
Home Financials are based on the most recent Mortgage that was taken out on this home.
Original Mortgage
$113,200
Interest Rate
7.95%
Create a Home Valuation Report for This Property
The Home Valuation Report is an in-depth analysis detailing your home's value as well as a comparison with similar homes in the area
Home Values in the Area
Average Home Value in this Area
Purchase History
| Date | Buyer | Sale Price | Title Company |
|---|---|---|---|
| Stibbs Stibbs Marie E Marie E | -- | None Available | |
| Revocabl Gerald E | -- | -- | |
| Stibbs Marie E | $147,000 | -- | |
| Landers Mark A | $142,000 | -- |
Source: Public Records
Mortgage History
| Date | Status | Borrower | Loan Amount |
|---|---|---|---|
| Previous Owner | Stibbs Marie E | $57,000 | |
| Previous Owner | Landers Mark A | $113,200 |
Source: Public Records
Tax History Compared to Growth
Tax History
| Year | Tax Paid | Tax Assessment Tax Assessment Total Assessment is a certain percentage of the fair market value that is determined by local assessors to be the total taxable value of land and additions on the property. | Land | Improvement |
|---|---|---|---|---|
| 2025 | -- | $263,699 | $46,000 | $217,699 |
| 2024 | -- | $250,277 | $44,000 | $206,277 |
| 2023 | -- | $222,482 | $38,000 | $184,482 |
| 2022 | $0 | $206,134 | $34,000 | $172,134 |
| 2021 | $0 | $193,125 | $34,000 | $159,125 |
| 2020 | $1,963 | $180,039 | $29,000 | $151,039 |
| 2019 | $1,963 | $167,249 | $29,000 | $138,249 |
| 2018 | $1,077 | $158,682 | $21,000 | $137,682 |
| 2017 | $669 | $153,493 | $21,000 | $132,493 |
| 2016 | $2,156 | $144,616 | $21,000 | $123,616 |
| 2015 | $987 | $140,802 | $21,000 | $119,802 |
| 2014 | $980 | $136,365 | $21,000 | $115,365 |
| 2012 | -- | $134,633 | $21,000 | $113,633 |
Source: Public Records
Map
Nearby Homes
- 16113 Josephine St
- 7011 S 167th Ave
- 7501 S 166th St
- 16130 Timberlane Dr
- 16125 Timberlane Dr
- 6441 S 159th Ave
- 16108 Adams St
- 16641 Olive St
- 7734 S 162nd St
- 15818 Timberlane Dr
- 7730 S 161st Terrace
- 7011 S 156th Avenue Cir
- 16112 Cottonwood Ave
- 16367 Y St
- 6212 S 158th St
- 7714 S 167th St
- 6001 S 160th St
- 7853 S 162nd St
- 7810 S 166th St
- 7216 S 170th St
- 7103 S 163rd St
- 7029 S 163rd St
- 7025 S 163rd St
- 7107 S 163rd St
- 7108 S 162nd Ave
- 7010 S 162nd Ave
- 7006 S 162nd Ave
- 7111 S 163rd St
- 7112 S 162nd Ave
- 7030 S 163rd St
- 16312 Josephine St
- 7017 S 163rd St
- 7026 S 163rd St
- 7002 S 162nd Ave
- 7116 S 162nd Ave
- 7115 S 163rd St
- 7116 162
- 7022 S 163rd St
- 16318 Josephine St
- 7013 S 163rd St