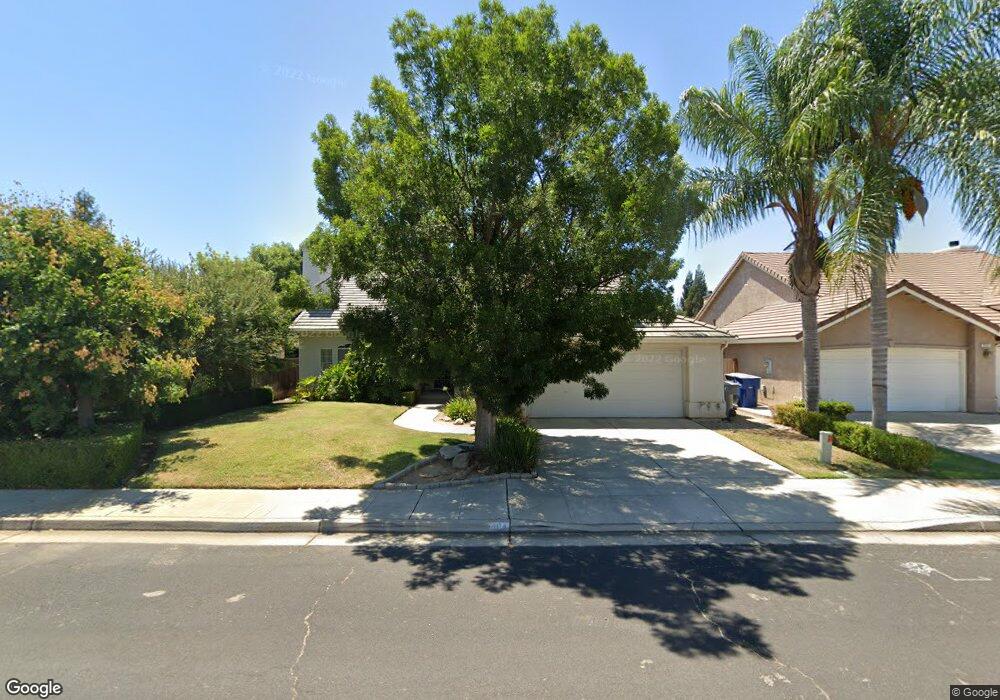
704 Applegate Ave Clovis, CA 93611
Estimated Value: $460,824 - $500,000
3
Beds
2
Baths
1,840
Sq Ft
$262/Sq Ft
Est. Value
About This Home
This home is located at 704 Applegate Ave, Clovis, CA 93611 and is currently estimated at $482,941, approximately $262 per square foot. 704 Applegate Ave is a home located in Fresno County with nearby schools including Cedarwood Elementary School, Clark Intermediate School, and Clovis High School.
Ownership History
Date
Name
Owned For
Owner Type
Purchase Details
Closed on
Jan 17, 2014
Sold by
Delariva Maryann and Kirk Kelly A
Bought by
Delariva Maryann and Kirk Kelly A
Current Estimated Value
Home Financials for this Owner
Home Financials are based on the most recent Mortgage that was taken out on this home.
Original Mortgage
$101,500
Interest Rate
4.4%
Mortgage Type
New Conventional
Purchase Details
Closed on
Dec 18, 2001
Sold by
Maguire Kelley and Maguire Elizabeth E
Bought by
Delariva Mary Ann and Kirk Kelly A
Home Financials for this Owner
Home Financials are based on the most recent Mortgage that was taken out on this home.
Original Mortgage
$155,300
Interest Rate
6.84%
Purchase Details
Closed on
Nov 9, 1999
Sold by
Maguire Kelley and Perera Elizabeth E
Bought by
Maguire Kelley and Maguire Elizabeth E
Home Financials for this Owner
Home Financials are based on the most recent Mortgage that was taken out on this home.
Original Mortgage
$18,947
Interest Rate
7.82%
Create a Home Valuation Report for This Property
The Home Valuation Report is an in-depth analysis detailing your home's value as well as a comparison with similar homes in the area
Home Values in the Area
Average Home Value in this Area
Purchase History
| Date | Buyer | Sale Price | Title Company |
|---|---|---|---|
| Delariva Maryann | -- | First American Title Company | |
| Delariva Mary Ann | $163,500 | First American Title Co | |
| Maguire Kelley | -- | -- |
Source: Public Records
Mortgage History
| Date | Status | Borrower | Loan Amount |
|---|---|---|---|
| Closed | Delariva Maryann | $101,500 | |
| Closed | Delariva Mary Ann | $155,300 | |
| Previous Owner | Maguire Kelley | $18,947 |
Source: Public Records
Tax History
| Year | Tax Paid | Tax Assessment Tax Assessment Total Assessment is a certain percentage of the fair market value that is determined by local assessors to be the total taxable value of land and additions on the property. | Land | Improvement |
|---|---|---|---|---|
| 2025 | $2,942 | $241,513 | $69,421 | $172,092 |
| 2023 | $2,819 | $232,136 | $66,726 | $165,410 |
| 2022 | $2,782 | $227,585 | $65,418 | $162,167 |
| 2021 | $2,707 | $223,124 | $64,136 | $158,988 |
| 2020 | $2,696 | $220,837 | $63,479 | $157,358 |
| 2019 | $2,645 | $216,508 | $62,235 | $154,273 |
| 2018 | $2,589 | $212,264 | $61,015 | $151,249 |
| 2017 | $2,533 | $208,103 | $59,819 | $148,284 |
| 2016 | $2,451 | $204,024 | $58,647 | $145,377 |
| 2015 | $2,414 | $200,961 | $57,767 | $143,194 |
| 2014 | $2,371 | $197,026 | $56,636 | $140,390 |
Source: Public Records
Map
Nearby Homes
- 793 Applegate Ave
- 2681 Wrenwood Ave
- 2691 Morris Ave
- 637 Coventry Ave
- 2871 Wrenwood Ave
- 865 McKelvy Ave
- 2963 Finchwood Ave
- 2337 Wrenwood Ave
- 2549 Purvis Ave
- 344 McKelvy Ave
- 937 Filbert Ave
- 603 Kaweah Ave
- 2668 Scott Ave
- 2231 Escalon Ave
- 2535 Sierra Ave
- 2034 Wrenwood Ave
- 3255 Roberts Ave
- 2518 Keats Ave
- 1178 Blackwood Ave
- 3154 Mitchell Ave
- 724 Applegate Ave
- 694 Applegate Ave
- 701 Hanson Ave
- 721 Hanson Ave
- 734 Applegate Ave
- 674 Applegate Ave
- 691 Hanson Ave
- 713 Applegate Ave
- 723 Applegate Ave
- 703 Applegate Ave
- 754 Applegate Ave
- 671 Hanson Ave
- 733 Applegate Ave
- 751 Hanson Ave
- 2653 Celeste Ave
- 2663 Celeste Ave
- 753 Applegate Ave
- 774 Applegate Ave
- 651 Hanson Ave
- 771 Hanson Ave
Your Personal Tour Guide
Ask me questions while you tour the home.